First posted by zweisystem on Tuesday, November 17, 2020 (updated)
I am reposting this from November 2020 because TransLink, civic and provincial politicians are singing hosannas about Bus Rapid Transit, with some going so far to say that BRT makes light rail obsolete!
What is damning today is that the numbers used in TransLink’s 2019 study for transit options are random, pulled out of the air.
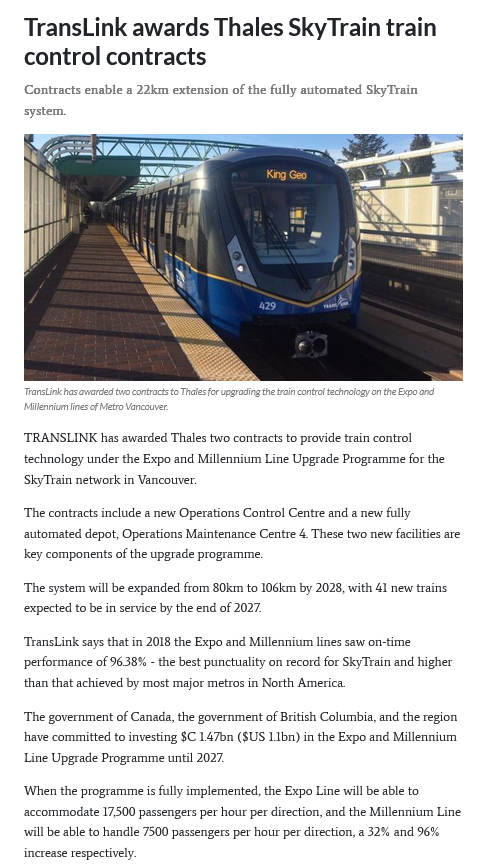
Today, according to Thales, who has won the $1.47 billion resignalling contract for the Expo and Millennium lines, the present maximum capacity of the Millennium Line is a mere 4,000 persons per hour per direction and after resignalling, the maximum capacity of the Millennium Line will be only 7,500; far less than the numbers used in the study.
Not only does this call into question the validity of this study, but the validity of every study offered by TransLink to date!
It is a given, that TransLink has very serious financial ills mostly stemming from the $16 billion cost of the full program to extend the Expo and Millennium Lines (Broadway Subway) 21.7 km. As always, the provincial government, the Mayor’s Council on Transit, and TransLink are cowards when it comes to telling the truth about transit and continue to do the same thing over and over again, pretending that are doing it right …… this time.
They are not.
It verifies what we all knew: that TransLink underestimated the capacity of surface rail by 150% and the time penalty by infinity.
Professor Patrick M. Condon, James Taylor Chair in Landscape and Livable Environments, UBC
Yes we all knew. American Transportation Expert, Gerald Fox told us in 2008:
The Evergreen Line Report made me curious as to how TransLink could justify continuing to expand SkyTrain, when the rest of the world is building LRT. So I went back and read the alleged Business Case (BC) report in a little more detail. I found several instances where the analysis had made assumptions that were inaccurate, or had been manipulated to make the case for SkyTrain. If the underlying assumptions are inaccurate, the conclusions may be so too.
We were also warned about ALRT (SkyTrain) back in the early 1980’s!
Our politicians, academics, and the mainstream media knew, but did not heed, either blinded by gadgetbahnen envy or were too easily bought and thus continues the planning charade that has so distorted our regional transit planning today.
Tram Capacity to UBC has been grossly understated:
Given the characteristics of the tram’s exclusive lane corridor listed above, a 2.5 minute headway is achievable. This is roughly 60% more practical capacity than a 4 minute headway.
Let us also remember:
The Millennium Line’s legal capacity, as per Transport Canada’s Operating Certificate is 15,000 pphpd. Please note:According to Thales 2022 News Release regarding their winning a $1.47 billion resignalling contract of the Expo and Millennium Lines; ““When the programme is fully implemented, the Expo Line will be able to accommodate 17,500 passengers per hour per direction, and the Millennium Line (Broadway Subway) will be able to handle 7500 passengers per hour per direction, a 32% and 96% increase respectively.” This means the current maximum capacity of the Millennium Line (Broadway Subway) is 4,000 pphpd!After resignalling, the Millennium Line will still have less capacity than what streetcars were carrying 75 years ago!
In the 1940’s and 50’s Toronto’s Bloor Danforth streetcar line operated coupled sets of PCC cars, offering a capacity of 12,500 pphpd.
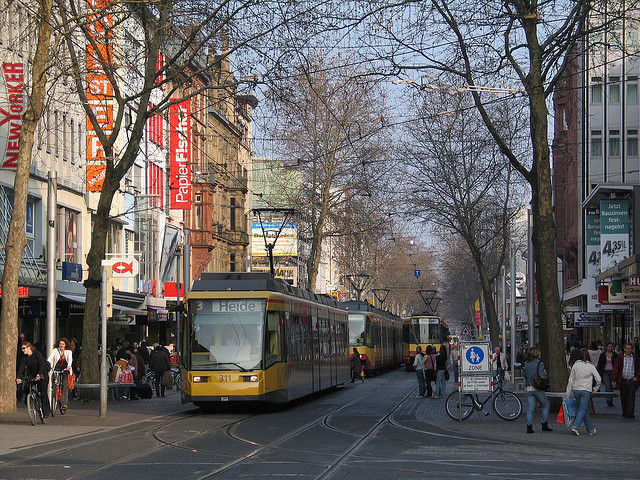
In Karlsruhe Germany, because of the success of TramTrain was seeing peak hour capacity of in excess of 30,000 pphpd.
Who says, LRT has less capacity than SkyTrain?
The Gelbe Wand or Yellow Wall of trams in Karlsruhe, Germany
As Gerald Fox summed up:
It is interesting how TransLink has used this cunning method of manipulating analysis to justify SkyTrain in corridor after corridor, and has thus succeeded in keeping its proprietary rail system expanding. In the US, all new transit projects that seek federal support are now subjected to scrutiny by a panel of transit peers, selected and monitored by the federal government, to ensure that projects are analyzed honestly, and the taxpayer interests are protected. No SkyTrain project has ever passed this scrutiny in the US.
******************************************
Background
In the Jan 2019 UBC transit report1, we see the demand forecast for transit options of Bus Rapid Transit (BRT), Light Rail Transit (LRT or street-running tram) and RRT (skytrain or ‘light-metro’). It is clear from the two pictures below, that RRT is the ‘winner’ or preferred option (as represented in the Jan 2019 report):
As an explanation to the charts immediately above, the 2019 report explains:
“ LRT ridership is forecast at about 60% that of RRT, partly because of slower travel times and the transfer penalty, but also because of capacity limitations. The increased speed, reliability and capacity of RRT attracts more ridership from latent and suppressed demand and better serves total demand along this corridor.”
According to the Jan 2019 study1, because of the following, RRT is the only suitable option for transit to UBC..
Travel times,
Transfer penalty
Capacity
It will be shown that the largest of these factors affecting LRT ridership is capacity. For this reason, this paper discusses the capacity limitation newly introduced by the 2019 study1, that was not a limiting factor in the 2012 study2 and why it is not correct.
The following is from our transit specialist in Ottawa.Mr. Haveacow, commenting on the post and is very informative.
The frustrating thing about the way Translink measured the capacity ranges for the various types of rapid transit technologies was because it was based on how they believed they would run the particular transit operating technology. It wasn’t based on how other more experienced regional transit properties ran their facilities or even close to the best-known Canadian or international operating practices of each type. This pretty much guarantees the results you want. The choice of Skytrain on Broadway was highly manipulated by this kind artificially low operational capacity and standards and practices that were poor choices for any comparison. I used Bus Rapid Transit as an example here not because I thought it was the best option on Broadway but as an example to show how poorly Translink’s BRT option really was compared to what could have been used in their report.
The Bus Rapid Transit norms used were inferior and far from the superior practices used by Ottawa and other cities.This absolutely shoddy choice of BRT infrastructure and operating practices shows the limited understanding Translink officials had on the subject. Thus it’s not surprising that the capacity limits believed for their BRT comparison were more than a little artificially low, especially compared to where and how they planned to operate the Skytrain.
How Translink Defined and Would Operate Bus Rapid Transit
I remember reading what Translink defined as Bus Rapid Transit in many of their past reports and giggling. Ottawa has operated real Bus Rapid Transit on our bus Transitway Network since 1983. Ottawa still has the most extensive network of BRT lines in North America, even with 12.5 km of BRT lines already converted to LRT and about 25 km more being converted presently. Many of the operating details of what Translink defined under BRT would be laughed at by longtime Ottawa Transitway passengers and not considered BRT but really, a glorified express bus with nice bus stops.
Professionally, many of the operating practices presently used or what Translink planned to use as BRT operational practices in their reports, showed at best an inexperienced operator and a lack of understanding about what you can really do with BRT. If you are going to measure BRT against Skytrain in a given corridor to determine the most useful operating technology, actually measure a real functioning line that is working within a real BRT operation. Not the joke Translink used to compare against the Skytrain. What was obvious from the start was that Translink doesn’t either understand or wouldn’t acknowledge that there are 2 main types or extremes, of BRT operations, open or closed systems. Choosing to mainly concentrate on either one has real operating advantages depending and different issues that very much effect what gets put in reports. Unfortunately the same lack of understanding can be said for their LRT and just general standard bus operating comparisons as well.
The example of BRT system Translink used was a mostly closed system which by their nature purposely limits operational capacity and bus numbers to preserve the infrastructure’s theoretical capacity. It greatly lowers cost as a result but Translink’s own documents downplayed the cost reality. It mainly concentrated on the capacity argument. The examples below are mostly open BRT systems which greatly increase operational capacity.
Before the conversion to LRT, during the height of both the AM and PM peak period, Ottawa’s Transitway would have a passenger level of 10,700 passengers per hour per direction. This was done using 185 to 200 buses per hour per direction on 85 seperate bus routes. During the day the Central Transitway would average between 4,000 to 6,000 pass/hr/direction using 60 to 80 buses/hr/direction.
Currently, during both peak periods Gatineau’s Rapi-Bus Transitway moves 4600 to 5000 pass/hr/direction using 90 to 100 buses/hr/direction.
Brisbane, Queensland, Australia “Brisbane Transport Agency known as “Translink” operates a successful BRT “The Busway Network” moves at peak 14,000 pass/hr/direction using 225 buses/hr/direction.
Pitsburgh’s Busway Network during both peaks sees 4500-4800 pass/hr/direction using 90-95 buses/hr/direction
Capacity and Cost is Important Here
The capacity of Translink’s BRT example in the report shows a service level of only a marginal improvement over the current bus system. Each one of these BRT examples I used uses far greater levels of buses than was currently planned for the Broadway Corridor, but their capacity far exceeds stated capacity levels of Bus Rapid Transit in the reports. The truly laughable BRT capacity used by Translink here can’t be realistically compared against a full Light Metro line operating in a tunnel. Especially if operating costs aren’t considered important. For example, data out of various projects in Montreal, Toronto and Ottawa all showed that a full scale BRT line is lower in cost per passenger and 30 year operating costs than a Light Metro line if that particular line is moving less than 134,000 people a day. Broadway has quite a while before it will consistently break that service level.
Compare Apples to Apples and Oranges to Oranges
The BRT example used in the Broadway report was mostly operating in a painted bus lane with some physical segregation. Painted bus lanes can be easily entered by other vehicles, they are almost impossible for any police service to regulate if it is more than a kilometre long, are highly effected by parking lanes, driveways and laneways, block lengths, the number, size, frequency of and types of intersections. Different types of intersection signaling and control and the sheer number of other lanes. Painted bus lanes have a very low numerical capacity 3000 to 5000 pass/hr/direction depending on many physical conditions. Lastly, the amount of external traffic is desperately important as well for the operating effectiveness of a painted bus lane. Unless the bus lane is a non painted, physically segregated from other traffic, the comparison of this bus lane to any train in a tunnel is meaningless.
To be fair, if you are going to measure a BRT lane against a Skytrain operating in a tunnel, the BRT lane needs to be in a tunnel as well!
The type of BRT operations used needs to have the capacity maximized to compete fairly against any type of train. The position of the BRT lanes also needs to be considered as well given other surface road conditions.
A mostly closed BRT system operating along mainly painted bus lanes, operating in the open, along with other mixed traffic lanes and having to enter signalized intersections will never compare favourably against the Skytrain operating below grade in a tunnel.
Stations become critical here because the report had fairly numerous bus stops that could only hold two articulated buses 18 to 20 metres long each. The Skytrain station platforms were 80 metres long. There were also more BRT stops than Skytrain Stations. That’s just not an equal comparison!
Well as time passes it never surprises me how a transit agency can find a new faith (the Church of BRT and suddenly embrace it with gusto) and still has enough energy to slap down another transit technology like LRT (mainly because they can only afford BRT now).
At least somebody at Translink paid notice that York Region Transit (serving a population 1.2 million) had pointed out to anyone who would listen that, for 8 .6 km of Finch Ave. to Richmond Hill Centre Subway, the expansion of the Yonge Street Subway line into the City of Richmond Hill (which is in York Region), can for the same amount of money, build over 100 km of their BRT Rapidway Busways, plus acquire more than 100 buses. There’s that I guess.
One of the interesting things about Vancouver Rapid Transit planning as of late, almost none of the planned Skytrain or BRT routes line up with the region’s busiest surface transit lines. Like it or hate it, only the Millennium Line extension to Arbutus and U.B.C. have anything to do with busiest parts of your existing surface transit network. The last 2 Skytrain extensions both the Evergreen and the Surrey to Langley Extensions have little to do with the busiest parts of your existing network.
Only the aborted Surrey Stage 1 LRT Line mirrored 2 or 3 of your current busiest bus lines. Both the Evergreen and the the current Surrey-Langley Skytrain extensions are in areas of potential passenger growith but certainly not anywhere near your busiest bus corridors.
One of the current planned BRT routes mirrors the old cancelled LRT Line with a second in the area of it in Surrey.
However, the primary BRT route being devloped and planned by Translink, collects passengers from the North-Shore (which is a laudable goal) then moves them across the Burrard Inlet but then avoids completely their primary goal to go downtown, via Hastings Street (which is one of your busiest surface transit corridors). Now it does make a connection to the westbound Millennium Line, but then heads south towards Metrotown, avoiding the lion’s share of your busiest bus routes which generally head west from Burnaby into the City of Vancouver, mainly heading towards either U.B.C. or downtown Vancouver/Stanley Park.
I have always found this very odd about Vancouver. Regardless of the operating technology of your rapid transit system, the majority of your rapid transit planning avoids most of he busiest travelled corridors and routes in your built up region.
There’s an old saying, “go where the passengers are going”.
Last thing guys, if your going to build real BRT lines try to make them single seat rides towarda most of the destinations for the majority of your potential passengers. The heavily promoted North-Shore to Metrotown BRT route forces one or multiple transfers to the majority of its potential passengers. Which isnt ideal for BRT passenger build up.
Zwei replies: Sadly, rapid transit is built to win votes and pump passengers onto the SkyTrain system.
Two items:
1) I had coffee with a former Metro Vancouver planner, who wanted to pick my brains about my real thoughts about transit. He confided in me that most transit planning, especially for SkyTrain came directly from the Premier’s Office and planners had a choice, either get on board or look for a new job.
He told me a few choice items (not for publication) and was not surprised at my assessment of the situation as it mirrored his. He indicated that if the “big money” does not come by 2028, the system will change completely. He was a SkyTrain supporter but now has come around to my point of view as “there was no way in hell could TransLink and the province afford any more SkyTrain Lines, especially with transportation fiascos across the province”.
He also said that, “there was absolutely no money for the Broadway subway to UBC” and confirmed what a ‘little birdie’ told me about the province and TransLink were planning an elevated alternative to UBC for SkyTrain to save money, but the politcans understood that would be politcal suicide for all involved.
2) I ventured into Vancouver on Wednesday to visit an aging relative who isn’t doing so well and I was stunned by the massive amount of densification in the city. The problem I can see that no one has planned for the extra traffic from this. The buses in the city were reasonably full (Granville and 41st area) but sparse in operation except for the express buses on 49th, which seem to be operating on Broadway B-Line schedule or a bus every 3 to 4 minutes.
But what I was looking for were bicycles in the bike lanes and they were as rare as hens teeth (weather was pleasant and sunny) and coming home via South West Marine Drive (best way to access the Oak St. Bridge) only one cyclist and 4 motorcycles were seen on the bike lanes! And this was at 2:30!
Not sure how nobody is being indicted over the scam which killed streetcar line which would have only cost around $100 million and taken just one year to build for more capacity than the subterrain line being built now.
Found out something interesting about the Thales signaling contract, it does include some track work and base slab work, however, it only includes the work necessary to implant the new signaling technology not the wholesale turnout, storage, power, power cabling connections and inlet track work that needs to be done.
Not only that, but I learned that your 99 B-Line bus only had 10,623,737 hoardings in 2024. That’s 34,161 to 40,861 passengers per business day, depending on your daily numbers conversion calculation method. Which puts it in at best, 4th in Toronto in 2024 or 9th if you use the lowest number, compared to other T.T.C. surface routes. Second place in 2024 Ottawa, if you use the arithmetic mean. Montreal’s numbers for 2024 have not been made available yet. I have not looked at Calgary, Edmonton, Ville De Quebec, Gatineau, Laval or any of the other Greater Golden Horseshoe properties yet.
Lastly, most transit properties in Canada are somewhere between 65%-95% of their pre 2020 system wide passenger levels with some, having areas or sectors of their operations actually exceeding the pre Covid levels. It’s very clear that Vancouver is still, regardless of what they say, below the pre Covid numbers system wide. There is a very interesting story of how GO Transit was able to almost double their weekend GO Train numbers by mid 2025 comparred to 2019. They managed to pass their weekend train ridership levels of 2019 in early 2023 and never looked back.
GO Transit to be fair, has been doing a lot track and station updates on all its lines as well as running more weekend trains but their greatest success has been partnering with several tourist spots and offering weekend getaway packages. Their most successful is the Train-Bus combo for Niagara Falls. You take the Train to Niagara Falls and a shuttle bus drops you off at several area locations. The actual falls, the floral clock, Clifton Hill Blvd, several of the viewing towers, the Niagara Gorge and the Whirlpool Rapids to name a few locations.
Considering the shear beauty of parts of B.C., I’m surprised that something similar hasn’t been tried with the Skytrain or the West Coast Express.
TransLink, sadly has not the imagination to do something like that.
On another note, cost overruns on the SkyTrain Langley extension is causing someone trying to rewrite history on the original light rail planning. What I have just learned, from two separate sources, that the official line on what was the final straw for the flip flop from LRT to SkyTrain was that due to cost overruns, they plan was to change from electric to diesel LRT operation.
Now i kept a close watch on this and never had I even had an inkling on this and the planners in Surrey I was in contact with, never even hinted at this.
In fact the only group that was advocating diesel operation was Rail for the Valley and that was for a Vancouver to Chilliwack route using light DMUs!
What I have been told is that. due to challenging times, the line remains partially underfunded and the hope of the NDP is force money from the feds to complete the line or leave large portions of unfinished route to embarrass the feds at the next election.