TTC Optimized: Designing an Improved 510-Spadina Streetcar Service
An interesting article about improving streetcar service on the 510 Adina route in Toronto.
I would like to remind everyone, that light rail (LRT) is a modern streetcar operating on a ‘reserved’ or dedicated Rights-of-ways, thereby obtaining a performance of that of a heavy-rail metro at a fraction of the cost.
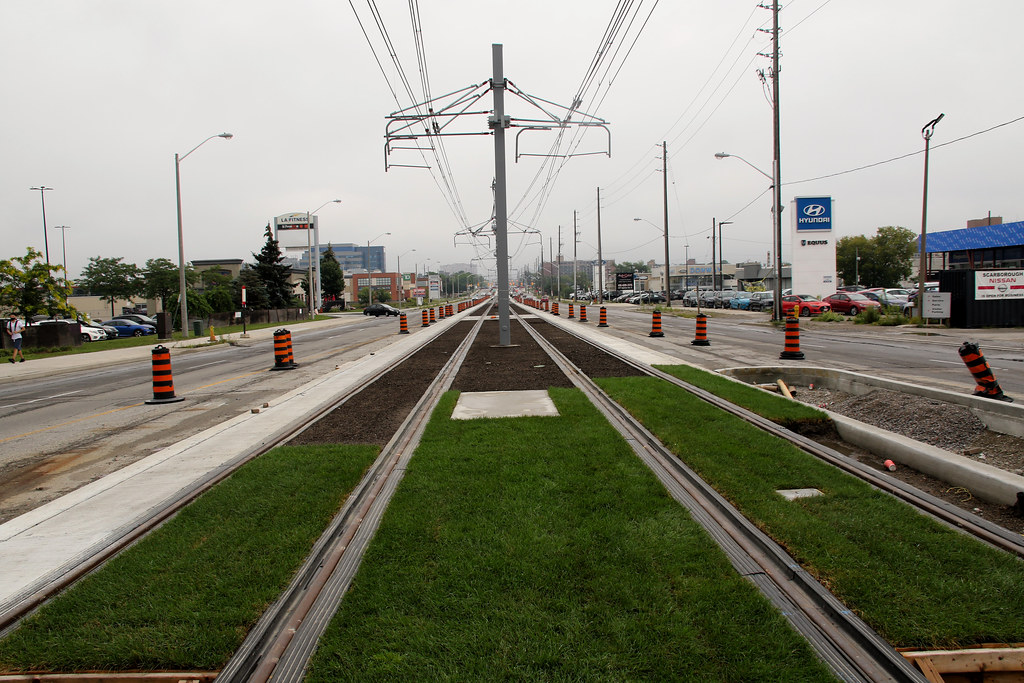
A reserved, lawned rights-of-way on the new Eglinton light rail in Toronto
TTC Optimized: Designing an Improved 510-Spadina Streetcar Service.
Jan 21, 2024
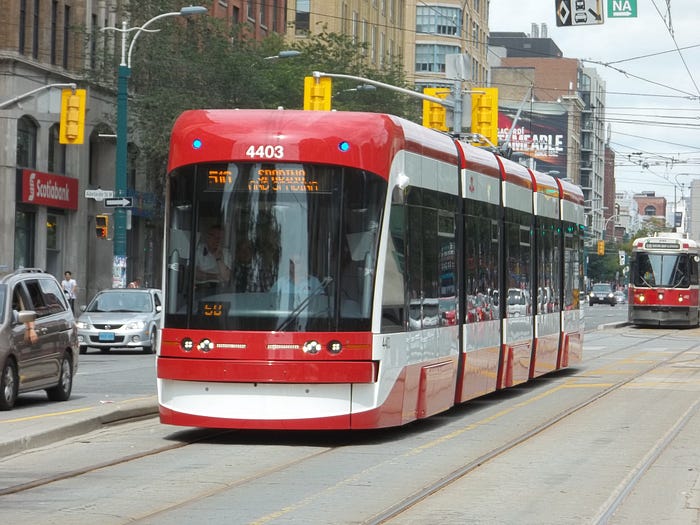
In Toronto’s vibrant landscape, the 510 Spadina Streetcar is more than just a transport option; it connects diverse communities and bustling marketplaces. Despite its crucial role, the streetcar, like many urban transit systems, struggles with efficiency and is slower than it needs to be. Suggestions for enhancement are often proposed, yet they lack the analytical foundation necessary to under the true impact of these changes.
This article presents a thorough analysis focused on how operational and infrastructural changes can effectively reduce travel times along the streetcar route. Key factors such as vehicle speed, stop frequency, traffic signal coordination, and operational speed limits are examined to identify viable improvements.
The methodology involves simulating the current operation of the 510 Spadina Streetcar, establishing a baseline that reflects the scheduled times set by the Toronto Transit Commission (TTC). This baseline is then used as a reference point for multiple simulations, each altering various input factors to assess their impact on overall travel time. Through this systematic exploration, the article seeks to not just advocate for quicker transit; but to reimagine urban mobility along Toronto’s iconic streetcar lines.
Methodology: Crafting the Analytical Framework
Data Collection and Preparation
The foundation of this analysis is built upon data from the TTC schedule and the City of Toronto’s traffic signal information. This combination allowed for an accurate depiction of the Spadina Streetcar’s route. The route was segmented into distinct parts, each representing the distance between two stops. Aligning the coordinates of streetcar stops with the city’s traffic signals, each signal was assigned to its respective route segment, following the streetcar’s travel direction. This resulted in a detailed list of segments, each including stops and traffic signal locations, ready for a comprehensive simulation. For example, stop 1 → traffic light1 → stop 2.
Simulation Parameters and Constraints
The simulation was designed to reflect real-world conditions with fixed constraints:
- A speed limit of 25 km/h.
- An acceleration and deceleration rate of 0.9 m/s² to mimic realistic vehicle dynamics.
- A static 20-second loading and unloading time at each stop, considering passenger movement.
These parameters set the stage for calculating the travel dynamics of the streetcar, encompassing acceleration to the speed limit, maintaining its speed, or decelerating for stops and signals.
Travel Scenarios
Four travel scenarios were developed to capture the variability of the streetcar’s journey:
- Stop to Stop: Travel from one stop to another, without intermediate traffic lights or stops.
- Stop to Continuous: Transition from a halt to continuous motion without stopping at the next segment.
- Continuous to Stop: The reverse of the above, where the streetcar slows to a stop.
- No Stop: Movement through consecutive green lights without halting.
Incorporating Traffic Signal Probabilities
Recognizing the critical role of traffic signals, a random variable was introduced. This variable assigned a 50% chance for the streetcar to encounter a red light at each stop, with waiting times between 1 and 60 seconds. Calculated independently for each signal, this randomness added an essential realism layer, capturing the unpredictability of urban traffic.
Running the Simulation
Travel time for each segment was calculated independently, based on stop locations and the traffic signal probability model. This simulation was repeated 100 times, providing statistical robustness and yielding the average time and standard deviation for each section between stops.
Further adjustments were made to certain input factors to align the simulation baseline closely with the TTC’s scheduled times during rush hour. This step was vital to compensate for unobservable variables in the data, such as traffic dynamics and operational constraints, establishing a reliable standard for measuring the impact of different scenarios.
Exploring Potential Improvements: Simulation Scenarios
To explore the full spectrum of potential enhancements to the 510 Spadina Streetcar service, a series of distinct simulation scenarios were crafted. Each scenario represents a strategic alteration in operational or infrastructural elements, aimed at reducing overall travel time and increasing efficiency.
1. Baseline & Simulation:
- Approach: This foundational scenario establishes a baseline by simulating the current state of the Spadina Streetcar with a 25 km/h speed limit, factoring in a 50% probability of stopping at red lights, with random wait times between 1 and 60 seconds at each signal.
- Purpose: As a comparative benchmark, this scenario allows for a clear assessment of the impact of subsequent modifications.
Results
- Total Time End to End: 28:47
- Slowest Average Speed: 7.52 km/h, Queen St. → King St.
- Fastest Average Speed: 16.16 km/h, Rees St. → Harbourfront Centre
2. Constant Speed Along Line
- Approach: This scenario looks to remove the need for streetcars to “crawl” through intersections that intersect with other streetcar lines
- Purpose: To quantify the effect of upgrading track switches and operational constraints on the overall travel time if streetcars don’t need to slow down when crossing some intersections
Results:
- Total Time End to End: 26:35 → 8.8% Faster than Baseline
3. Speed Limit Increase
- Approach: This scenario makes only one change, increasing the speed limit from 25 km/h to 35 km/h
- Purpose: As a comparative benchmark, this scenario allows for a clear assessment of the impact of subsequent modifications.
Results:
- Total Time End to End: 25:37 → 12.2% Faster than Baseline
4. Minor Transit Signal Priority (TSP) — Minor Intersections Only:
- Implementation: Envisioning full TSP at all minor intersections, while maintaining standard traffic sequences at major intersections.
- Specifics: The probability of encountering a red light is drastically reduced to 2.5% on designated minor streets, while it remains at 50% on major streets: College, Dundas, Queen, King, Front, Lakeshore
- Goal: To evaluate the effectiveness of TSP in minimizing delays at less critical intersections.
Results 1:
- Speed Limit: 25 km/h
- Total Time End to End: 24:36 → 18.5% Faster than Baseline
Top 3 Sections — Speed Improvements
- Queen St → King St: 51.6%
- Bremner Blvd → Lower Spadina/Queen Quay: 34.2%
- Front St → Bremner Blvd: 34.1%
Results 2:
- Speed Limit: 35 km/h
- Total Time End to End: 21:03 → 27.8% Faster than Baseline
Top 3 Sections — Speed Improvements
- Queen St → King St: 83.6%
- Spadina Station → Sussex Ave: 61.7%
- Front St → Bremner Blvd: 58.1%
5. Removal of Closely-Spaced Stops:
- Action: Eliminating certain stops that are within 250 meters of one another, specifically at Sussex, Willcox, Nassau, Sullivan, and Bremner
- Rationale: To test whether reducing the number of stops could contribute to a quicker transit experience without significantly impacting accessibility.
Results 1:
- Speed Limit: 25 km/h
- Total Time End to End: 26:43% → 8.4% Faster than Baseline
Results 2:
- Speed Limit: 35 km/h
- Total Time End to End: 23:14% → 20.3% Faster than Baseline
6. Enhanced Transit Signal Priority — Extended to Major Intersections:
- Expansion: Extending TSP to include major intersections, modifying the chance of hitting a red light to 15% at these locations, and reducing waiting times to a range of 1–20 seconds.
- Expectation: To observe the potential time savings when TSP is applied more broadly across the route.
Results 1:
- Speed Limit: 25 km/h
- Total Time End to End: 23:30% → 19.4% Faster than Baseline
Top 3 Sections — Speed Improvements
- Queen St → King St: 50.5%
- King St → Front St: 40.5%
- Front St → Bremner Blvd: 38.4%
Results 2:
- Speed Limit: 35 km/h
- Total Time End to End: 19:59% → 34.6% Faster than Baseline
Top 3 Sections — Speed Improvements
- Queen St → King St: 85.4%
- King St → Front St: 67.9%
- Willcox St → College: 65.2%
7. Combined Approach — Enhanced TSP and Stop Removal
- Combination: Integrating the strategies of enhanced TSP and the removal of closely spaced stops.
- Anticipation: This scenario aims to gauge the cumulative effect of these modifications, offering a glimpse into a more streamlined and rapid transit service.
Results 1:
- Speed Limit: 25 km/h
- Total Time End to End: 21:40% → 25.7% Faster than Baseline
Results 2:
- Speed Limit: 35 km/h
- Total Time End to End: 17:58% → 38.4% Faster than Baseline
It is important to note that traffic impacts were not considered in these scenarios, as the Spadina 510 operates on a grade-separated line, distinct from car traffic.
Final Results & Observations
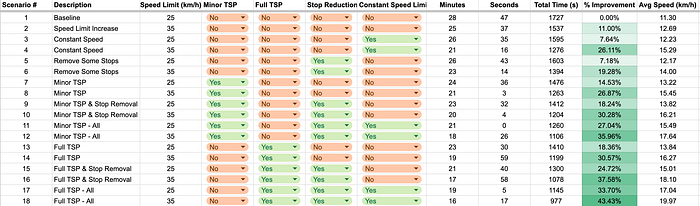
The above chart outlines all outlined individual scenarios and scenario combinations. Some observations from this analysis are:
- Increasing the speed limit from 25km/h to 35km/h offers 11% savings without making any other changes.
- It is not surprising, but full TSP offers the most savings overall at 18.4% at 25km/h and 30.57% at 35km/h.
- Removing stops alone only saves a couple of minutes, it requires some sort of TSP to fully realize the potential savings it can offer.
- There are diminishing returns as you add more simulation parameters, and there are tradeoffs to making each of these changes which may not be worth it for minimal improvements.
The results for individual options when the speed limit remains at 25 km/h are:
- Full / Enhanced TSP: 18.36%, 5:17 in time savings
- Partial TSP: 14.53%, 4:11 in time savings
- Constant Speed Through Intersections: 7.64%, 2:12 in time savings
- Remove Some Stops: 7:18%, 2:04 in time savings
Increasing the speed limit from 25km/h to 35km/h adds anywhere between 9–12% in additional savings depending on the scenario.
Conclusion & Recommendations
When looking at all of the possible options, it is easy to point to the final scenario (all potential improvements) and recommend this option since it provides the greatest possible time savings. However, none of the scenarios come for free and have tradeoffs to consider. For example, removing stops may reduce travel times but now riders need to walk farther to reach their stop, which may increase their total travel time. Additionally, full TSP will be very expensive and take a lot of coordination to implement and maintain.
Based on these considerations, my recommendation would be to implement minor TSP with a focus on maintaining a constant speed, with a speed limit of 35 km/h. This will cut down travel time by 32.54%, which saves approximately 9:23 in travel time from Spadina to Union. This scenario doesn’t give maximum time savings, but provides the highest benefit-to-cost ratio for a few reasons:
- Transit signal priority on minor streets will be easier to implement since fewer people cross these streets, no other transit lines intersect Spadina at these streets, and it will have a minimal impact on motorists travelling on other major roadways. It also avoids the increased complexity of designing signalling at major intersections (ex. Spadina & Dundas).
- Removing stops at minor intersections can result in significant time savings, but not in a vacuum. Streetcars typically have to stop for a red light before reaching a stop on a minor street, and then stop again at the stop. Eliminating the need to stop first at a red light is a prerequisite before we can explore removing stops.
- Maintaining a higher average speed will also require safety enhancements to the line. In more congested areas, there is a risk of cars blocking intersections or pedestrians crossing tracks unexpectedly. These issues will need to be addressed to increase speeds along the line.
- The “crawl” at major intersections due to the current streetcar track switches does not have as big an impact as expected since the streetcar is already slowing down to stop on the other side of the street. The immense cost and disruption caused by upgrading these switches will not provide large enough time savings to justify the cost.
Overall, the main theme here is that streetcars need to reach a higher top speed and remain there for as long as possible. Limiting red lights and reducing the need to slow down for safety reasons are steps that need to be taken to realize the potential time savings for this line or any other line in the city.