The eventual outcome on Eglinton, Mr. Miller charges, was predictable: The TTC had built and run all of the city’s subways and streetcar lines for a century; Metrolinx, which the province created in 2006 to draft a regional transit masterplan and run its GO Transit commuter bus and rail lines, had at the time barely built anything at all.
“To have an agency that was a planning agency oversee the largest [P3] proposal in the history of Canada, it’s madness,” he said of the Metrolinx takeover. “It just made no sense.”
Mr. Miller also says the Eglinton fiasco is the end result of what he says has been a growing provincial desire in recent decades – shared by both the previous Liberals, and Mr. Ford’s current PCs – to meddle in things the former mayor believes should be best left to the city government.
The premier’s pledge to fund all of Transit City would not last.
In 2010, amid the fallout of the global financial crisis, Mr. McGuinty would partially renege, chopping his pledged billions for the new LRTs in half and prompting the TTC to halt its imminent move to seek bidders to build the Eglinton line. Later that year, the TTC and Metrolinx would agree on today’s shortened, 19-kilometre Eglinton line, pledging to have it done by 2020.
Mr. Miller said that if the TTC had been able to get a Crosstown contract signed before the province cut its funding, it would have been harder for Mr. McGuinty, and Mr. Miller’s successors at City Hall, to keep redrawing the plans.
And redraw them they did.
After Mr. Miller chose not to run for a third term, he was replaced by Rob Ford, the current premier’s now-deceased brother.
Rob Ford had campaigned as a culture warrior against surface light-rail, blaming it for taking up traffic lanes, while intoning a mantra of “Subways! Subways! Subways!” He scrapped the Transit City plans on his first day in office in December 2010, and vowed to bury the entire Eglinton line, which would have added billions to the cost.
But his city council rebelled and reinstated the more affordable, partially tunnelled proposal for Eglinton in 2012.
In 2016, a worker looks down into where the LRT trains will enter and exit the tunnel. When Rob Ford became mayor in 2010, he moved to have the entire line buried, but that decision was reversed a couple years later.
It wasn’t only Mr. Miller who advocated against a Metrolinx takeover to install a P3. Behind the scenes, engineers and transit officials were also engaged in their own tug-of-war.
A TTC staff report from May 2012 is eerily prescient.
The TTC asked a panel of experts with the American Public Transit Association to look over the province’s plans. Prominent transit authority executives, who had overseen major subway and LRT projects in New York City, Los Angeles and Philadelphia, took part.
They concluded that Metrolinx’s promised 2020 completion date was “extremely challenging” and “unrealistic,” with 2022-23 being more likely. The report also warned of “uncertainty” around the purported advantages of the P3 model, which had rarely been used for large transit projects – although Vancouver’s Canada Line, completed on time in 2009, in time for the Winter Olympics the following year, was a P3.
(Later in 2012, the City of Ottawa would sign it’s own ill-fated LRT P3, which would be plagued by delays and shutdowns after opening day – shadows that account for Metrolinx’s reluctance to rush opening the Crosstown without extensive testing.)
The TTC report also predicted that the province’s Eglinton plan would cause “disproportionate disruption” to neighbourhoods along the route, and didn’t allow enough time for potential contract changes, the complexities of relocating water and gas pipes or the building of a massive interchange station at Yonge Street.
The construction of the LRT, shown here in 2018, disrupted the neighbourhoods along Eglinton for years.
Plus, the panel said that such a large contract as the Crosstown’s may make true competitive bids unlikely as few companies are big enough to take it on. Just two consortiums would later bid on the project.
There were other warnings about P3s that the province ignored, including from its Auditor-General, who in 2014 reviewed 74 of Infrastructure Ontario’s P3 projects and concluded they would have collectively cost $8-billion less if they had been handled by the public sector in the conventional way.
Clive Thurston, head of the Ontario General Contractors Association at the time, was involved in the release of a 2013 report by an umbrella group called the Construction and Design Alliance of Ontario that warned that the mega-sized Eglinton tender would squeeze out smaller, local companies. The report said that bundling the contract together was dampening competition and could add an estimated $500-million to the cost of the project.
Mr. Thurston also says he made his case in meetings with ministers and officials, arguing that the contract should be chopped into smaller chunks, but got nowhere, and so went public and took his concerns in 2013 to the media.
He said the government’s clear shift towards P3s, and the powerful private-sector lobby for them – backed by Bay Street and big industry players – was just too strong.
The Canadian Council for Public-Private Partnerships, an industry association that has promoted P3s since the 1990s, even gave the Crosstown project a “gold” award for “project finance” at their annual gala dinner in 2015, an event usually attended by prominent businesspeople and politicians.
“‘We told you so’ just doesn’t seem to cut it,” Mr. Thurston said in a recent interview. “It’s kind of satisfactory to know we were right. But so what? Nobody listened.”
Metrolinx and Crosslinx lock into legal battles
In 2015, then-Ontario transportation minister Steven Del Duca, now the mayor of Vaughan, announced that the P3 Crosstown contract, worth (at the time) $9.1-billion, had been awarded to Crosslinx, for the line and all its systems and stations, and 30 years of maintenance. (The tunnels had been dug beforehand, with separate contracts.)
The consortium includes the former SNC-Lavalin – now known as AtkinsRéalis – as well as other major construction and infrastructure players Aecon, EllisDon and ACS-Dragados. The completion date was also pushed to 2021.
The problems started almost immediately. Crosslinx submitted its own designs for stations and sections of the line 12 to 18 months late.
There were also – unnecessary in hindsight – concerns and a court battle with delay-plagued Bombardier over whether it would be able to deliver the line’s fleet of vehicles in time for opening day.
(In recent testing, these same vehicles – some of which are now a decade old – have had problems with brake pad wear, and ventilation and communication systems, hampering Eglinton’s progress.)
Bombardier’s delay in the manufacturing of the LRT’s fleet of vehicles caused concern, but that was before the entire project’s deadline was extended.
It wasn’t long after the 2017 appointment of former ScotRail Alliance managing director Phil Verster to the top job at Metrolinx that relations between the agency and Crosslinx would become confrontational, and end up in court – with Mr. Verster responding with pointed, public criticism of the consortium.
He quit last December and was replaced by Mr. Lindsay, who had run Infrastructure Ontario since 2020. Mr. Verster, whose salary had risen to more than $880,000 a year by his departure, did not respond to LinkedIn messages requesting comment for this story.
A source familiar with the inner workings of the project said that Metrolinx under Mr. Verster had put itself on what amounted to a war footing, sending Crosslinx hundreds of formal notices alleging it had failed to adhere to parts of the contract instead of taking a more collaborative approach to fixing the various problems that emerged during construction. The Globe is not identifying the source as they were not authorized to speak publicly about the project.
Tensions boiled over in the summer of 2018 when Crosslinx hit back in a court filing alleging that the delays plaguing the project were due to utility work beyond its control and the sluggish pace of government permits and approvals.
Metrolinx would later have to hand over $237-million to settle the fight, as revealed in a report on the mess from the province’s Auditor-General that also said the agency had “limited remedies” under the terms of the contract.
In another legal battle in 2020, this time over Metrolinx’s decision to deny that the COVID-19 pandemic constituted an emergency under the contract, a judge sided with Crosslinx, saying the provincial agency’s approach was “neither a fair nor reasonable approach.” This time the settlement cost Metrolinx another $325-million, with the opening date pushed to 2023.
But in April of that year, then-transportation minister Caroline Mulroney announced that the consortium had “no credible schedule” for completion of the project. Mr. Verster said there were 260 “quality issues” that remained outstanding, including mislaid tracks, but did not release a public list.
Crosslinx would hit back with yet another legal filing that May, blaming “undue interference” from the TTC, which is to operate the line. In a public statement, Mr. Verster dismissed the lawsuit as a delay tactic.
The Eglinton Crosstown’s tracks and stations, shown here in 2021, have been completed for a while, but testing of the line was still needed. Eglinton’s shorter sister line on Finch Avenue West, also a P3 and well behind schedule, could open sooner than the Crosstown, even though construction only started in 2019.
The consortium, under fire but barred by its contract from speaking to the media to defend itself, decided to break those terms and give a Toronto Star reporter a tour of the nearly complete line in 2023.
EllisDon president CEO Geoff Smith, who is now the company’s executive chairman, told The Star that the relationship with Metrolinx was “broken.” He said both sides had underestimated the transit line’s vast complexity, and that this kind of project can “threaten companies.”
Susan Sperling, a spokesperson for Crosslinx, declined to comment for this story.
History of transit projects in Toronto
Yonge Subway
Union to Eglinton (now Line 1)
Groundbreaking: 1949
Completion: 1954
Length: 7.4 km
Delay: Start delayed for two years, due to postwar shortages
Projected cost: $32.4-million (1946)
Final cost: $67-million ($783.57-million in 2025 dollars)Cost per kilometre in 2025 dollars: $105.89-million
🚇
7 years (1959-1966)
John Boyd/The Globe and Mail
University/Bloor-Danforth Subway
Line 1 Union to St. George, Line 2 Woodbine to Keele
Groundbreaking: 1959
Completion: 1966
Length: 16 km
Delay: None, completed one year ahead of schedule
Projected cost: $189-million (1958)
Final cost: $206-million ($1.94-billion in 2025 dollars)Cost per km in 2025 dollars: $121.25-million
🚇
8 years (1994-2002)
Tibor Kolley
Sheppard Subway
Line 4
Groundbreaking: 1994
Completion: 2002
Length: 6.4 km
Delay: None, opened on schedule
Original cost: $875-million (1996)
Final cost: $934-million ($1.53-billion in 2025 dollars)Cost per kilometre in 2025 dollars: $239.38-million
🚋
5 years (2005-2010)
Fred Lum/The Globe and Mail
St. Clair Streetcar Right-of-Way
Groundbreaking: 2005
Planned opening date: 2009
Completion: 2010 (opened in stages starting in 2007)
Length: 6.8km (all on surface)
Delay: Eight months, due to court challenge
Final cost: $106-million ($149.65-million in 2025 dollars)Cost per kilometre in 2025 dollars: $22-million
🚇
8 years (2009-2017)
Fred Lum/The Globe and Mail
Spadina Subway Extension
Groundbreaking: 2009
Planned opening date: 2015
Completion: 2017
Length: 8.6 km
Original cost: $2.8-billion
Final cost: $3.2-billion ($4.05-billion in 2025 dollars)Cost per km in 2025 dollars: $470.09-million
🚧
14+ years (2011-2025?)
Mark Blinch/The Globe and Mail
Eglinton Crosstown LRT
Groundbreaking: 2011
Planned opening date: 2020
Finished: Not completed, and no projected date has been released
Length: 19 km
Projected cost: $5.3-billion (2010 dollars)
Final cost: $13.087-billion (2025) (includes 30 years of maintenance.) Total spent on construction as of June 30, 2025: $9.238-billion. Cost per km in 2025 dollars: $688.88-million (using projected total number, including maintenence); $486.21-million (using amount spent on construction to date)
I do not know enough about Toronto’s Eglinton’s new LRT, to accurately comment on the project; only that portions of the system is definitely not LRT. That being said, this two part series from the Globe and Mail will help inform those on the other side of the mountains about this hugely expensive project.
Meddling politicians, a massive contract, multimillion-dollar lawsuits and a pandemic have turned the Eglinton Crosstown LRT into a 14-year project
For months, they have glided along the middle of Toronto’s Eglinton Avenue: Sleek, empty streetcars on test runs, stopping at platforms blocked off to the public. No one gets on or off. And before the two-car vehicle pulls away, its electronic chimes sound their pointless warnings as the doors close.
Here in Scarborough, on a strip lined with mall parking lots, cars and buses full of people – relegated to the road’s remaining traffic lanes – just roll on by as though the weed-choked rail line occupying the median isn’t there.
This is the Eglinton Crosstown, a running joke in the city often invoked in the same resigned tone as Toronto’s perpetually frustrated hockey hopes: Will the Maple Leafs ever win another Stanley Cup? Will the Crosstown ever open?
The Eglinton LRT is widely regarded as the most delay-plagued major public transit project in Canadian history. First proposed in 2007, construction only finally began in 2011, with completion set for 2020 – five years ago and counting.
The project clogged this main artery through Canada’s largest city with lane closures, hoarding and construction dust for years. While the line itself is mostly complete, Metrolinx, the province’s public-transit agency responsible for the project, has given up predicting an opening date.
This month, commuters waiting for buses could see Eglinton Crosstown LRT vehicles pass by on their test runs. The testing is nearing its end, but an official date for the line’s launch has yet to be announced.
Although a previous Liberal provincial government launched the Crosstown, the Progressive Conservatives of Premier Doug Ford, now in their eighth year in office, have been unable to put the project on track. Toronto’s city council and Ontario’s Opposition NDP have demanded a public inquiry, to no avail.
The bill for this partially tunnelled, 19-kilometre light-rail line is currently pegged at $13.08-billion, including 30 years of maintenance – around $8-billion more than estimated back when construction began. Its 25 stations, still empty, are spread from Mount Dennis in the west end to Kennedy Station in the east. https://charts.theglobeandmail.com/LtnPq/4/
How can a light-rail line have taken 14 years, and counting? First, a revolving door of politicians rewrote and ripped up the plans for years before work began, as they often do. Then came design delays, the unforeseen complexity of moving gas and water pipes, mislaid tracks, leaky stations, buggy signalling software and the COVID-19 pandemic.
Experts and some involved in the project say many of the problems were a result of its structure as Canada’s largest ever “public-private partnership,” or P3, a type of contract that typically hands over an entire project – design, construction, some of its financing, future maintenance – to the private sector. Before the advent of the P3 model, governments or their agencies would more or less just design a project themselves, and then hire contractors to build it. And in this case, in order to turn the Crosstown into a P3, the province stripped the city’s Toronto Transit Commission of control of the project.
Some critics also blame the adversarial relationship that developed between Metrolinx and the private consortium of leading construction companies it hired to build the line, known as Crosslinx Transit Solutions. The two would battle over legal challenges that would cost Metrolinx hundreds of millions of dollars to settle.
The line’s progress, or lack thereof, has largely been cloaked in silence – even as governments profess a renewed focus on accelerating big infrastructure projects and maintain that public transit is key to housing and climate-change goals.
At an event in September to boast of progress on the Scarborough subway extension in Toronto’s east end, Ontario Transportation Minister Prabmeet Sarkaria and Metrolinx CEO Michael Lindsay insisted that the province has learned key lessons from the Eglinton mess – lessons they say are being applied as they charge ahead with their ambitious multi-billion-dollar list of other transit megaprojects in Toronto, including the $27-billion Ontario Line subway.
System testing tantalizes Torontonians who would like to start riding the LRT; the line had been planned to be operational by 2020.
But a review of the tortured history of the Crosstown reveals that, more than a decade ago, the provincial government of the day failed to heed credible warnings from local politicians, public-transit leaders and voices in the province’s construction business who had all warned that the Crosstown P3 contract was just too big, too risky and too complex – and would end badly.
After months of testing, Eglinton finally is undergoing a kind of final dress rehearsal: a 30-day “revenue service demonstration” – with no passengers – meant to ensure it can handle the rigours of daily operation. (A collision between two vehicles in their storage yard forced Metrolinx to pause operation for a few days, the government acknowledged last week.) An eastbound test train crosses the bridge over the Don River. When first conceived, the LRT was to go from Kingston Road all the way to Pearson airport; its terminus is now Mount Dennis, but the construction of a western extension began in 2021, to be completed by 2031. Gabriel Hutchinson/The Globe and Mail
If the test ultimately succeeds, the earliest civilians could hop on the Crosstown would be sometime in November. But Mr. Lindsay has also warned to expect a gradual “ramp up,” not full service on Day 1. No one in Toronto is holding their breath.
Metrolinx’s overseeing the project ‘just made no sense’
Among those who warned that the province’s approach on Eglinton would end in disaster is David Miller, Toronto’s mayor from 2003 to 2010.
“It’s frankly not very nice to be vindicated,” he said in a recent interview with The Globe and Mail.
He was behind the original vision for the Crosstown, which he laid out as part of a broader network of light-rail lines in 2007 in a plan branded as “Transit City,” complete with slick maps and collectible buttons.
Mr. Miller’s Eglinton project had a lowballed early cost estimate of $2.2-billion, which had not been fully fleshed out and did not include things like vehicle-storage facilities. It was initially intended to be much longer, running more than 30 kilometres, from Kingston Road in the east to Pearson Airport in the west.
Ontario premier Dalton McGuinty, here seen speaking at the 2007 announcement of funding for Toronto mayor David Miller’s “Transit City” plans, suggested Ottawa would help foot the bill for the LRT, but that never came to pass.
Just months after unveiling his plans, Mr. Miller stood beaming at an event at a Mississauga bus garage, with his Transit City vision apparently set to be realized.
Then-premier Dalton McGuinty hopped out of a bus for the TV cameras and pledged to cover at least two-thirds of the cost of the Transit City LRTs.
Mr. McGuinty’s aim was to have the rest of the bill covered by Ottawa, and to proceed without the typical cash contribution from the strapped city budget. However, a federal cheque never materialized, and the province would later assume the entire cost.
Mr. Miller says now it was a mistake for the city not to have some skin in the game, as its power over the project began to wane. By 2008, Metrolinx was already pushing behind the scenes for changes, including unsuccessfully gunning to put the whole line underground, or on stilts, or run an updated version of the Bombardier-made vehicles used on the now-defunct Scarborough RT line.
Indeed, the free ride for the city laid the groundwork for an eventual provincial takeover.
Initially, the project was to be run like all previous TTC major transit expansions. While the province, in this case, did make its Metrolinx agency the owner of the Eglinton and the other Transit City LRT lines it pledged to build – since it was paying the full cost – it had agreed that the TTC would still oversee the projects, and still mostly build them in its usual way.
The usual way, for the TTC and most other transit agencies in decades past, was to design a transit line first, either with in-house engineers or consultants, and then put out contracts for competitive bids and hire companies to build the line, its stations and any required vehicles.
But in April 2011, Metrolinx and its provincial masters told the TTC they had changed their minds, and wanted oversight of the plan. The TTC resisted the idea. But by 2012, it was official: Metrolinx would take over the project and bring in Infrastructure Ontario, a provincial agency created in 2005 that had championed P3s for hospitals and courthouses, to run the procurement.
When Metrolinx sidelined the TTC, Toronto’s transit agency had to toss out tens of millions of dollars of design and engineering work – putting the project back years even before it got under way.
Mr. Miller, long a critic of P3s, argues that if the TTC had been left to its own devices on the Crosstown and built it in the conventional way, Torontonians would have been riding it for five or even seven years by now.
Mayor David Miller, right, is shown a model of the boring machine that would be used to dig tunnels for the Eglinton Crosstown. Mr. Miller initially suggested the project could cost $2.2-billion; now, the projected price for the project, which includes 30 years of maintenance, is $13.08-billion.
He points to the Sheppard Subway, completed on time and on budget (for just under $1-billion) in 2002. Even the TTC’s troubled Spadina subway extension to Vaughan, which cost $400-million more than pledged and required the hiring of private-sector project managers to finish it two years past due in 2017, looks rosy when compared to the Crosstown.
An interesting article about improving streetcar service on the 510 Adina route in Toronto.
I would like to remind everyone, that light rail (LRT) is a modern streetcar operating on a ‘reserved’ or dedicated Rights-of-ways, thereby obtaining a performance of that of a heavy-rail metro at a fraction of the cost.
A reserved, lawned rights-of-way on the new Eglinton light rail in Toronto
TTC Optimized: Designing an Improved 510-Spadina Streetcar Service.
In Toronto’s vibrant landscape, the 510 Spadina Streetcar is more than just a transport option; it connects diverse communities and bustling marketplaces. Despite its crucial role, the streetcar, like many urban transit systems, struggles with efficiency and is slower than it needs to be. Suggestions for enhancement are often proposed, yet they lack the analytical foundation necessary to under the true impact of these changes.
This article presents a thorough analysis focused on how operational and infrastructural changes can effectively reduce travel times along the streetcar route. Key factors such as vehicle speed, stop frequency, traffic signal coordination, and operational speed limits are examined to identify viable improvements.
The methodology involves simulating the current operation of the 510 Spadina Streetcar, establishing a baseline that reflects the scheduled times set by the Toronto Transit Commission (TTC). This baseline is then used as a reference point for multiple simulations, each altering various input factors to assess their impact on overall travel time. Through this systematic exploration, the article seeks to not just advocate for quicker transit; but to reimagine urban mobility along Toronto’s iconic streetcar lines.
Methodology: Crafting the Analytical Framework
Data Collection and Preparation
The foundation of this analysis is built upon data from the TTC schedule and the City of Toronto’s traffic signal information. This combination allowed for an accurate depiction of the Spadina Streetcar’s route. The route was segmented into distinct parts, each representing the distance between two stops. Aligning the coordinates of streetcar stops with the city’s traffic signals, each signal was assigned to its respective route segment, following the streetcar’s travel direction. This resulted in a detailed list of segments, each including stops and traffic signal locations, ready for a comprehensive simulation. For example, stop 1 → traffic light1 → stop 2.
Simulation Parameters and Constraints
The simulation was designed to reflect real-world conditions with fixed constraints:
A speed limit of 25 km/h.
An acceleration and deceleration rate of 0.9 m/s² to mimic realistic vehicle dynamics.
A static 20-second loading and unloading time at each stop, considering passenger movement.
These parameters set the stage for calculating the travel dynamics of the streetcar, encompassing acceleration to the speed limit, maintaining its speed, or decelerating for stops and signals.
Travel Scenarios
Four travel scenarios were developed to capture the variability of the streetcar’s journey:
Stop to Stop: Travel from one stop to another, without intermediate traffic lights or stops.
Stop to Continuous: Transition from a halt to continuous motion without stopping at the next segment.
Continuous to Stop: The reverse of the above, where the streetcar slows to a stop.
No Stop: Movement through consecutive green lights without halting.
Incorporating Traffic Signal Probabilities
Recognizing the critical role of traffic signals, a random variable was introduced. This variable assigned a 50% chance for the streetcar to encounter a red light at each stop, with waiting times between 1 and 60 seconds. Calculated independently for each signal, this randomness added an essential realism layer, capturing the unpredictability of urban traffic.
Running the Simulation
Travel time for each segment was calculated independently, based on stop locations and the traffic signal probability model. This simulation was repeated 100 times, providing statistical robustness and yielding the average time and standard deviation for each section between stops.
Further adjustments were made to certain input factors to align the simulation baseline closely with the TTC’s scheduled times during rush hour. This step was vital to compensate for unobservable variables in the data, such as traffic dynamics and operational constraints, establishing a reliable standard for measuring the impact of different scenarios.
To explore the full spectrum of potential enhancements to the 510 Spadina Streetcar service, a series of distinct simulation scenarios were crafted. Each scenario represents a strategic alteration in operational or infrastructural elements, aimed at reducing overall travel time and increasing efficiency.
1. Baseline & Simulation:
Approach: This foundational scenario establishes a baseline by simulating the current state of the Spadina Streetcar with a 25 km/h speed limit, factoring in a 50% probability of stopping at red lights, with random wait times between 1 and 60 seconds at each signal.
Purpose: As a comparative benchmark, this scenario allows for a clear assessment of the impact of subsequent modifications.
Results
Total Time End to End: 28:47
Slowest Average Speed: 7.52 km/h, Queen St. → King St.
Fastest Average Speed: 16.16 km/h, Rees St. → Harbourfront Centre
2. Constant Speed Along Line
Approach: This scenario looks to remove the need for streetcars to “crawl” through intersections that intersect with other streetcar lines
Purpose: To quantify the effect of upgrading track switches and operational constraints on the overall travel time if streetcars don’t need to slow down when crossing some intersections
Results:
Total Time End to End: 26:35 → 8.8% Faster than Baseline
3. Speed Limit Increase
Approach: This scenario makes only one change, increasing the speed limit from 25 km/h to 35 km/h
Purpose: As a comparative benchmark, this scenario allows for a clear assessment of the impact of subsequent modifications.
Results:
Total Time End to End: 25:37 → 12.2% Faster than Baseline
4. Minor Transit Signal Priority (TSP) — Minor Intersections Only:
Implementation: Envisioning full TSP at all minor intersections, while maintaining standard traffic sequences at major intersections.
Specifics: The probability of encountering a red light is drastically reduced to 2.5% on designated minor streets, while it remains at 50% on major streets: College, Dundas, Queen, King, Front, Lakeshore
Goal: To evaluate the effectiveness of TSP in minimizing delays at less critical intersections.
Results 1:
Speed Limit: 25 km/h
Total Time End to End: 24:36 → 18.5% Faster than Baseline
Top 3 Sections — Speed Improvements
Queen St → King St: 51.6%
Bremner Blvd → Lower Spadina/Queen Quay: 34.2%
Front St → Bremner Blvd: 34.1%
Results 2:
Speed Limit: 35 km/h
Total Time End to End: 21:03 → 27.8% Faster than Baseline
Top 3 Sections — Speed Improvements
Queen St → King St: 83.6%
Spadina Station → Sussex Ave: 61.7%
Front St → Bremner Blvd: 58.1%
5. Removal of Closely-Spaced Stops:
Action: Eliminating certain stops that are within 250 meters of one another, specifically at Sussex, Willcox, Nassau, Sullivan, and Bremner
Rationale: To test whether reducing the number of stops could contribute to a quicker transit experience without significantly impacting accessibility.
Results 1:
Speed Limit: 25 km/h
Total Time End to End: 26:43% → 8.4% Faster than Baseline
Results 2:
Speed Limit: 35 km/h
Total Time End to End: 23:14% → 20.3% Faster than Baseline
6. Enhanced Transit Signal Priority — Extended to Major Intersections:
Expansion: Extending TSP to include major intersections, modifying the chance of hitting a red light to 15% at these locations, and reducing waiting times to a range of 1–20 seconds.
Expectation: To observe the potential time savings when TSP is applied more broadly across the route.
Results 1:
Speed Limit: 25 km/h
Total Time End to End: 23:30% → 19.4% Faster than Baseline
Top 3 Sections — Speed Improvements
Queen St → King St: 50.5%
King St → Front St: 40.5%
Front St → Bremner Blvd: 38.4%
Results 2:
Speed Limit: 35 km/h
Total Time End to End: 19:59% → 34.6% Faster than Baseline
Top 3 Sections — Speed Improvements
Queen St → King St: 85.4%
King St → Front St: 67.9%
Willcox St → College: 65.2%
7. Combined Approach — Enhanced TSP and Stop Removal
Combination: Integrating the strategies of enhanced TSP and the removal of closely spaced stops.
Anticipation: This scenario aims to gauge the cumulative effect of these modifications, offering a glimpse into a more streamlined and rapid transit service.
Results 1:
Speed Limit: 25 km/h
Total Time End to End: 21:40% → 25.7% Faster than Baseline
Results 2:
Speed Limit: 35 km/h
Total Time End to End: 17:58% → 38.4% Faster than Baseline
It is important to note that traffic impacts were not considered in these scenarios, as the Spadina 510 operates on a grade-separated line, distinct from car traffic.
Final Results & Observations
Final Results — All Scenarios
The above chart outlines all outlined individual scenarios and scenario combinations. Some observations from this analysis are:
Increasing the speed limit from 25km/h to 35km/h offers 11% savings without making any other changes.
It is not surprising, but full TSP offers the most savings overall at 18.4% at 25km/h and 30.57% at 35km/h.
Removing stops alone only saves a couple of minutes, it requires some sort of TSP to fully realize the potential savings it can offer.
There are diminishing returns as you add more simulation parameters, and there are tradeoffs to making each of these changes which may not be worth it for minimal improvements.
The results for individual options when the speed limit remains at 25 km/h are:
Full / Enhanced TSP: 18.36%, 5:17 in time savings
Partial TSP: 14.53%, 4:11 in time savings
Constant Speed Through Intersections: 7.64%, 2:12 in time savings
Remove Some Stops: 7:18%, 2:04 in time savings
Increasing the speed limit from 25km/h to 35km/h adds anywhere between 9–12% in additional savings depending on the scenario.
Conclusion & Recommendations
When looking at all of the possible options, it is easy to point to the final scenario (all potential improvements) and recommend this option since it provides the greatest possible time savings. However, none of the scenarios come for free and have tradeoffs to consider. For example, removing stops may reduce travel times but now riders need to walk farther to reach their stop, which may increase their total travel time. Additionally, full TSP will be very expensive and take a lot of coordination to implement and maintain.
Based on these considerations, my recommendation would be to implement minor TSP with a focus on maintaining a constant speed, with a speed limit of 35 km/h. This will cut down travel time by 32.54%, which saves approximately 9:23 in travel time from Spadina to Union. This scenario doesn’t give maximum time savings, but provides the highest benefit-to-cost ratio for a few reasons:
Transit signal priority on minor streets will be easier to implement since fewer people cross these streets, no other transit lines intersect Spadina at these streets, and it will have a minimal impact on motorists travelling on other major roadways. It also avoids the increased complexity of designing signalling at major intersections (ex. Spadina & Dundas).
Removing stops at minor intersections can result in significant time savings, but not in a vacuum. Streetcars typically have to stop for a red light before reaching a stop on a minor street, and then stop again at the stop. Eliminating the need to stop first at a red light is a prerequisite before we can explore removing stops.
Maintaining a higher average speed will also require safety enhancements to the line. In more congested areas, there is a risk of cars blocking intersections or pedestrians crossing tracks unexpectedly. These issues will need to be addressed to increase speeds along the line.
The “crawl” at major intersections due to the current streetcar track switches does not have as big an impact as expected since the streetcar is already slowing down to stop on the other side of the street. The immense cost and disruption caused by upgrading these switches will not provide large enough time savings to justify the cost.
Overall, the main theme here is that streetcars need to reach a higher top speed and remain there for as long as possible. Limiting red lights and reducing the need to slow down for safety reasons are steps that need to be taken to realize the potential time savings for this line or any other line in the city.
……..Of What We Call SkyTrain And It Is A Proprietary Light Metro! Get Over It!
This was first published in 2021, but with all the hype about building the Broadway subway, the city of Vancouver has reverted back to to the old song that, what we call SkyTrain, is a successful brand and definitely not proprietary.
So back into the archives I go.
And yes, since this was published, it seems a Brazilian company has trademarked the name SkyTrain for their proprietary transit system, as their Emails remind me.
The term SkyTrain is used on a lot of elevated transit systems, notably Vancouver and Bangkok.
BTS Bangkok is a conventional railway, operating as a regional metro system and is no relation to the proprietary “SkyTrain” light-metro system in Vancouver.
The Kuranda SkyTrain or Sky-rail in Australia, is an aerial tramway.
What is the city of Vancouver playing at? Why the deliberate misinformation?
What they are calling the SkyTrain brand in Vancouver, is not a brand, rather the name of the regional light-metro system, chosen via radio contest by CKNW in 1985.
So, as a refresher, I will start with the brands that our light-metro system has been marketed under.
Intermediate Capacity Transit System (ICTS)
Advanced Light Rail Transit (ALRT)
Advanced Light Metro (ALM)
Advanced Rapid Transit (ART)
Innovia Rapid Transit
Movia Automatic Light Metro (MALM)
The various brands have been owned by four companies:
The Urban Transit Development Corporation (UTDC)
Lavalin
Bombardier Inc.
Alstom
Powered by Linear Induction Motors, MALM certainly is, as most unconventional railways are proprietary. The MALM system is not compatible in operation on any other railway, other than its family of now six systems (Toronto abandoned their ICTS system) and no other company has ‘off the shelf’ vehicles that can be used on the MALM system.
As stated before, Alstom now hold the technical patents and SNC Lavalin hold engineering patents.
The city of Vancouver should be wary, as this blatant attempt to mislead the public could come back and haunt them legally in the future.
Two and a half decades later, the following lessons have not been learned by TransLink, Metro Vancouver and the provincial NDP. It is sheer negligence on the part of TransLink, the Mayor’s Council on Transit, and the Ministry of Transportation, that they remain ignorant of what was commonly known elsewhere, not just a decade or so ago, rather four decades ago.
“Those who ignore history are doomed to repeat it”
Ignorance of the truth, is not a defense.
Lesson #1
In the very early 1980’s, the Ontario Conservative Party (the William Davis Government) tried to force the Toronto Transit Commission (TTC) to build with the new Intermediate Capacity Transit System or ICTS, now known as SkyTrain; produced by the Urban Transit Development Corporation (UTDC) an Ontario crown corporation. The TTC commissioned a comprehensive study comparing streetcars/LRT and metro with ICTS and the results were not encouraging to those wishing to sell ICTS. The information and conclusions of the Accelerated Rapid Transit Study (ARTS) gave the City of Hamilton enough ammunition to reject the Ontario provincial government lead, construction planning for ICTS in the city.
The TTC transit study, the Accelerated Rapid Transit Study or ‘ARTS’ found that:
“ICTS costs anything up to ten times as much as a conventional light-rail line to install, for about the same capacity; or put another way, ICTS costs more than a heavy-rail subway, with four times its capacity.”
ICTS was dead in the water as a product, so UTDC did what every other manufacturer does when faced with this dilemma, they changed the name from ICTS to ALRT or Advanced Light Rail Transit and sold the unsalable ICTS to some political rubes out West, namely Bill Bennett and Grace McCarthy, the leader and deputy leader of the British Columbia Social Credit Party and the rest, as they say, is history.
Toronto’s ICTS system, one of three built, closed for good in 2023.
Lesson #2
In the 1980’s there was much debate between modern light-rail and many proprietary transit systems being offered for sale, which included the SkyTrain ICTS/ALRT automatic light-metro. Many claims were made by the owners of various proprietary transit systems being offered for sale, about the effectiveness of their transit systems.
In 1991, Gerald Fox a noted American transit specialist, produced a study comparing light-rail and automatic guided transit (AGT) systems including SkyTrain and the French VAL light-metro system. The study concluded that despite the hype and hoopla of the promoters of AGT systems, there was no benefit in building with more expensive AGT. These conclusions were not lost on American and European transit planners, who wanted ‘the best bang for the buck’ and the desire to build prestigious and expensive light-metro systems waned from the mid 90’s until the present day.
Conclusions from Gerald Fox’s A Comparison Between Light Rail And Automated Transit Systems. (1991)
Requiring fully grade separated R-O-W and stations and higher car and equipment costs, total construction costs is higher for AGT than LRT. A city selecting AGT will tend to have a smaller rapid transit network than a city selecting LRT.
There is no evidence that automatic operation saves operating and maintenance costs compared to modern LRT operating on a comparable quality of alignment.
The rigidity imposed on operations by a centralized control system and lack of localized response options have resulted in poor levels of reliability on AGT compared to the more versatile LRT systems.
LRT and AGT have similar capacities capabilities if used on the same quality of alignment. LRT also has the option to branch out on less costly R-O-W.
Being a product of contemporary technology, AGT systems carry with them the seeds of obsolescence.
Transit agencies that buy into proprietary systems should consider their future procurement options, particularly if the original equipment manufacturer were to cease operations.
Today TransLink and the provincial government still make unfounded claims of superior operation for SkyTrain (if it doesn’t snow) and denounces LRT as a poor-man’s rapid transit system. Nothing could be further than the truth and it still seems TransLink and the SkyTrain lobby have failed to read and understand transit lessons, taught over four decades ago!
France’s VAL system, a French proprietary Light Metro.
The provincial government is now spending over $16 billion to extend the Expo and Millennium Lines a mere 21.7 km. Currently the project is currently underfunded by $3 to $4 billion.
As well, there is growing pressure on the provincial government to extend the Broadway subway to UBC at a now estimated cost of $8 billion. Added to this there is more than growing pressure to extend SkyTrain to the North Shore at a cost of in excess of $10 billion!
Yet, there is no actual proof that SkyTrain has taken cars off the road. A great portion of SkyTrain’s ridership is merely recycling bus customers, as over 80% of the light metro’s ridership first take a bus.
There has been no sales of the proprietary railway in over 25 years and only six remain in operation, yet Metro Vancouver, The Mayor’s Council on Transit, the Ministry of Transportation and the Provincial NDP still call the system “world class” and continue to plan and build with it, even though Alstom, who now owns the system, is selling the Kingston plant which produces the proprietary rail vehicles and CN Rail has applied to abandon the spur line servicing the plant.
The Kingston Plant, soon to be sold home of the Innovia 300 (MALM) vehicle production.
Vancouver’s SkyTrain, the only ‘world class’ system in the world, that no one wants to buy! Now, that is world class!
What is is badly needed in BC and Canada is regional railways.
Local pundits have called for faster and faster rail transit, with some even advocating for high speed rail (HST) for the Fraser Valley as the only way to get people out of their cars.
The current cost for the Expo Line extension to Langley is now in excess of $350 million/km and a stand alone HST would cost much more, when one factors in land acquisition and the larger kinematic envelope needed for HST.
Funding please!
Today, with gas costing anywhere between $1.40 to $1.80 a litre, but for the future, especially when we are facing the whims of a American President, who presently seems hell bent tariffs, invading Greenland and Panama and making Canada the 51st state, alternative transportation is a must.
What is needed is a network of user-friendly rail line to entice customers to rail and those willing to try a modern DMU or EMU for a somewhat longer but far more comfortable trip may find a slower train far more enticing.
Rail for the Valley’s, Leewood Study sees a 90 minute trip time from Chilliwack to Scott Road Station, about 30 minutes slower than taking the car, in perfect conditions.
Perfect conditions is more and more a rarity on Hwy.1!
For many, the extra 30 minutes travel time will be well worth not dealing with gridlock and congestion and just enjoying the journey itself. With the added prospect of sipping a fresh coffee from a ‘Bistro Car’ could just seal the deal, taking the train.
A slow train to Chilliwack, just maybe, will be the fast train to success!
Famous for its high-speed TGV trains, France is now seeing the launch of a new rail revolution – slow trains. John Lichfield looks at the ambitious plan to reconnect some of France’s forgotten areas through a rail co-operative and a new philosophy of rail travel.
Published: 26 January 2022
The slow trains would better connect rural France. Photo: Eric Cabanis/AFPFrance, the home of the Very Fast Train, is about to rediscover the Slow Train.From the end of this year, a new railway company, actually a cooperative, will offer affordable, long-distance travel between provincial towns and cities. The new trains – Trains à Grande Lenteur(TGL)?– will wander for hours along unused, or under-used, secondary lines.The first service will be from Bordeaux to Lyon, zig-zagging across the broad waist of France through Libourne, Périgueux, Limoges, Guéret, Montluçon and Roanne. Journey time: seven hours and 30 minutes.Other itineraries will eventually include: Caen to Toulouse, via Limoges in nine hours and 43 minutes and Le Croisic, in Brittany, to Basel in Switzerland, with 25 intermediate stops in 11 hours and 13 minutes.
To a railway lover like me such meandering journeys through La France Profonde sound marvellous. Can they possibly be a commercial proposition?
Some of the services, like Bordeaux-Lyon, were abandoned by the state railway company, the SNCF, several years ago. Others will be unbroken train journeys avoiding Paris which have never existed before – not even at the height of French railway boom at the end of the 19th century.
The venture has been made possible by the EU-inspired scrapping of SNCF’s monopoly on French rail passenger services. The Italian rail company Trenitalia is already competing on the high-speed TGV line between Lyon and Paris.
The low-speed trains also grow from an initiative by President Emmanuel Macron and his government to rescue some of France’s under-used, 19th century, local railways – a reversal of the policy adopted in Britain under Dr Richard Beeching from 1963.
The cross-country, slow train idea was formally approved by the rail regulator before Christmas. It has been developed by French public interest company called Railcoop (pronounced Rye-cope), which has already started its own freight service in south west France.
Ticket prices are still being calculated but they are forecast to be similar to the cost of “ride-sharing” on apps like BlaBla Car.
A little research shows that a Caen-Toulouse ticket might therefore be circa €30 for an almost ten-hour journey. SNCF currently demands between €50 and €90 for a seven-and-a-half-hour trip, including crossing Paris by Metro between Gares Saint Lazare and Montparnasse.
Maybe Railcoop is onto something after all.
The company/cooperative has over 11,000 members or “share-holders”, ranging from local authorities, businesses, pressure groups, railwaymen and women to future passengers. The minimum contribution for an individual is €100.
SNCF DMU X74502 at Valencay after arriving with train RE61277 the 1402 from Salbris
The plan is to reconnect towns ignored, or poorly served, by the Train à Grande Vitesse (TGV) high speed train revolution in France of the last 40 years. Parts of the Bordeaux-Lyon route are already covered by local passenger trains; other parts are now freight only.
For the time being it plans to lease and rebuild eight three carriage, diesel trains which have been made redundant in the Auvergne-Rhône-Alpes region.
There will be no space for a buffet or restaurant car. Restaurants and shops along the route will be invited to prepare local specialities which will be sold during station stops and eaten on board.
What a wonderful idea: French provincial meals on wheels; traiteurs on trains.
Olivia Wolanin of Railcoop told me: “We want to be part of the transition to a greener future, which is inevitably going to mean more train travel.
“We also want to offer journeys at a reasonable price to people who live in or want to visit parts of France where train services have all but vanished. We see ourselves as a service for people who have no cars – but also for people who DO have cars.”
Full disclosure. I am a fan of railways. I spent much of my childhood at Crewe station in Cheshire closely observing trains.
The government commissioned senior civil servant, and rail-lover, François Philizot to study the problem. After many delays, he reported that much of the French rail network was in a state of “collapse”. Far from turning out to be a French Beeching, he recommended that a few lines might have to close but most could and should be saved – either by national government or by regional governments.
Since then the Emmanuel Macron-Jean Castex government has promised a big new chunk of spending on “small lines” as part of its €100 billion three year Covid-recovery plan. Even more spending is needed but, for the first time since the TGV revolution began in 1981, big sums are to be spent on old lines in France as well as new ones.
The Railcoop cross-country network, to be completed by 2024-5, will run (at an average of 90 kph) partly on those tracks. Can it succeed where a similar German scheme failed?
François Philizot suggested in a recent interview with Le Monde that a revival of slow trains might work – so long as we accept that a greener future will also be a less frenetic future.
“When you’re not shooting across the country like an arrow at 300 kph, you can see much more and you can think for much longer,” Philizot said.
Gaslighting: a form of psychological manipulation in which a person or a group covertly sows seeds of doubt in a targeted individual or group, making them question their own memory, perception, or judgment, often evoking in them cognitive dissonance and other changes including low self-esteem. Using denial, misdirection, contradiction, and misinformation, gaslighting involves attempts to destabilize the victim and delegitimize the victim’s beliefs. Instances can range from the denial by an abuser that previous abusive incidents occurred, to the staging of bizarre events by the abuser with the intention of disorienting the victim.
When it comes to regional transit and regional transit planning, UBC Students, abetted by TransLink’s gas-lighting, rules.
Three issues which TransLink’s gaslighting has been a success.
SkyTrain is not a proprietary transit system.
Broadway is the most heaviest used transit route in Canada, no North America
LRT is in inferior
The SkyTrain Light-Metro system includes a proprietary transit system.
The question those claiming that SkyTrain is not a proprietary transit system, must ask; “Since when did the proprietary Movia Automatic Light Metro cease to be a proprietary transit system?“
SkyTrain is the name of the regional light-metro network and not the commercial trains used.
The Canada line uses conventional EMU’s made by ROTEM.
The Expo Line used the the proprietary Advanced Light Rail Transit (ALRT) system, renamed from the original Intermediate Capacity Transit System (ICTS), developed by the Urban Transportation Development Corporation (UTDC), an Ontario Crown corporation. The later Advanced Rapid Transit (ART) cars (MK.2’s), which came with the Millennium Line, were produced by Bombardier after it acquired the remains of the UTDC after it was returned to the Ontario government when Lavalin went Bankrupt.
Lavalin briefly owned the proprietary railway, renaming the proprietary transit system Advanced Light Metro (ALM) but the UTDC was returned to the Province of Ontario, after Lavalin went bankrupt trying to sell the often renamed proprietary transit system to Bangkok.
Montreal rebuilt the curs using their Innovia light-metro body-shell.
The Mk.5 cars, TransLink boast about, are Innovia 300 cars with open vestibules and have been on the market for about 20 years.
Bombardier’s Innovia line of light-metros, due to lack of sales was folded into the Movia heavy-rail metro line, with the proprietary system called Movia Automatic Light Metro.
MALM is now owned by Alstom, when they acquired Bombardier’s rail division.
The key to the MALM system being proprietary is the use of Linear Induction Motors and the steerable axle trucks as no other company offers an “off the shelf” product compatible to operate son the MALM Lines.
As one German Engineer told me; “One just cannot slap on a pair of LIM’s on a conventional bogie (truck) and expect it to operate!“
The steerable axle truck, and LIM, are the key to the proprietary light metro.
Broadway is not the busiest transit corridor in Canada.
The hype and hoopla that Broadway being the the heaviest used transit route in Canada, no North America is a common refrain one reads in the mainstream media and hears on the radio or TV, made by politicians and bureaucrats.
Sorry it’s not true as the following from TransLink confirms.
“Finally, on January 31, 2019, you contacted several news organizations and this Secretariat raising concerns over TransLink’s assertion that the 99 B-Line is the busiest bus route in the US and Canada.
This is our region’s most overcrowded bus route. Pass ups are already common, as our regular riders on that route are fully aware. TransLink projects that the 99 B-Line from Arbutus to UBC will be at capacity in the peak when the Millennium Line extension from Commercial-Broadway to Arbutus opens.”
Cutting through the TransLink speak of this reply, TransLink only admits to Broadway being “our region’s most overcrowded bus route” and nothing more. What seems to be causing overcrowding is not heavy use, rather poor management because the capacity offered by B-line buses is under 2,000 persons per hour per direction at 3 minute headway’s.
The 99 B-Line bus only had 10,623,737 hoardings in 2024. That’s 34,161 to 40,861 passengers per business day, depending on your daily numbers conversion calculation method. Which puts it in at best, 4th in Toronto in 2024 or 9th if you use the lowest number, compared to other T.T.C. surface routes. Second place in 2024 Ottawa, if you use the arithmetic mean.
The claims that the 99 B-Line route on the Broadway Corridor moves 60,000 customers per day, are just, claims.
To increase capacity, why not offer peak hour 2 minute headway’s for the 99 B-Line and increase capacity by 50%; much simpler and affordable than a $4 billion subway.
Light rail is not inferior.
TransLink’s anti LRT screed is laughable and in the real world, they would be “thrown off the stage” with the drivel they peddle.
It seems TransLink’s six figured salaried bureaucrats can’t or won’t read transit history for if they had, they would know that only seven of the now called Movia Automatic Light Metro proprietary transit systems have been built over the past 40 years, under six different names. During the same period well over over two hundred and fifty new build Light rail lines have been built and most of the existing streetcar/ram systems have been upgraded or partially upgraded to light rail standards.
No MALM system has been sold in the past two decades.
Modern trams, today can obtain capacities beyond 20,000 pphpd on portions of their routes at peak hours. This is why modern light rail has been so successful due in part for its ability to carry heavy passenger loads when need be. This is part of the flexibility of service inherent in modern light rail.
According to Thales, who has won the $1.47 billion re-signalling contract for the Expo and Millennium lines, the present maximum capacity of the Millennium Line is a mere 4,000 persons per hour per direction and after re-signalling, the maximum capacity of the Millennium Line will be only 7,500.
Toronto streetcars were obtaining peak hour capacity of over 12,000 pphpd on select routes in the late 1940’s and early 1950’s!
Today, the modern tram can operate as a mainline passenger train, a light-metro, light-rail and a streetcar all on the same route! Modern LRT has a proven record of attracting motorists from the car creating a viable modal shift from car to transit.
The last forty years has seen an unprecedented investment either building new or refurbishing existing transit systems around the world. It is a field where success is eagerly copied and what is deemed poor avoided. During this time, no other city has copied Vancouver’s transit planning, nor has copied Vancouver’s exclusive use of light-metro.
Sadly, TransLink’s “gaslighting” has so perverted transit planning in the region, that there is absolutely no hope of any coherent transit planning for the foreseeable future. UBC Students demanding a $8 billion subway to UBC, continue gas-lighting the media and public, continuing the Goebbels Gambit, of repeating lies often enough that the public begin to believe it!
The end result; Vancouver continues building with a “museum piece” transit system, too expensive to deal with today’s transit ills.
Move over E&N, passenger service on the former BC Rail, will soon take the spotlight in BC politics.
What is needed is a comprehensive passenger rail policy for the province, but never fear Premier’s Eby is fully focused spending $16 billion to extend the SkyTrain network a mere 21.7 km.
Again, the ruling NDP are extremely weak with any sort of “Green” rail policy and fumbles around with BRT (lite) and bicycle lanes as a cure for our current transportation malaise.
Sadly, the loyal opposition, Rustad’s Conservatives are mired in self immolation with anti-VAX/science types, homophobia, and has absolutely no vision for BC, except some sort of MAGA world clone of the USA.
Don’t hold your breath, as new highways are on order, ready for the next election.
BC Rail’s Cariboo Prospector RDC passenger service is viewed from the cab of the Whistler Northwind at Lime, B.C., on July 2, 2001. The mayor of Squamish, B.C., is asking the government to hold consultations on Canadian National’s plans to end operations on the route. Bob Johnston
SQUAMISH, British Columbia — The mayor of Squamish is asking British Columbia’s Minister of Transportation and Transit to convene consultations over Canadian National Railway’s plan to end operations on 214 miles of its former BC Rail line through Squamish.
In Canada, consultations are a formal process to gather information and opinions from affected parties and others with an interest in a topic to help inform government actions.
Squamish Mayor Armand Hurford, in an Aug. 22 letter to Minister Mike Farnsworth, asked Farnsworth to hold consultations with “affected municipalities, regional districts, and First Nations,” saying CN’s plans to discontinue operations on portions of its Squamish and Lilloeet subdivisions places at risk benefits of the rail service including economic development, regional mobility, and climate resilience. On the latter point, Hurford’s letter says, “The line proved critical during th 2021 floods, offering supply chain redundancy in challenging terrain — a necessity in building resilience to climate change.”
CN informed Squamish officials of the plan to “decommission” the line — which it lhas eased from the province since 2003 — in a July 11 letter, saying the route does not have sufficient traffic. Among operations that could be affected is Rocky Mountaineer’s “Rainforest to Gold Rush” excursion between North Vancouver and Jasper, Alberta [see “CN seeks to end lease …,” Trains.com, July 22, 2025].
The Squamish Chief newspaper first reported both CN’s plan and the mayor’s request, which was included with the agenda for a District Council meeting scheduled for today (Sept. 2, 2025). The letter was provided to the council for informational purposes; no action is scheduled as part of the meeting agenda.
First published in 2009., The post has been updated.
A Wee Bit Of Local History
In early 1996, during BC Transit’s meaningless public consultation period for the Broadway Lougheed Rapid Transit Project which later morphed into the Millennium Line, Zwei received a phone call from an European Transit specialist, who worked for Asea Brown Boverai (later absorbed by Bombardier Inc.) regarding the project.
The European transit specialist, wanting to make contact with those planning for light-rail, had phoned BC Transit to arrange a meeting regarding the then proposed Broadway/Lougheed LRT project and was given Zwei’s phone number instead!
After his initial shock and displeasure being fobbed-off by BC Transit, the transit specialist entered into a long conversation with me on transit issues in the region and how modern light rail could help solve them. To make a long story short, he proposed a classic European style tramway for Broadway, with stops every 500m to 600m, going from BCIT to UBC, replacing all Broadway bus services and a second line via Main Street, Hastings St. to Stanley Park, that, he claimed would double present bus ridership on the two routes within two years, providing enough fare revenue for the tram to operate without any subsidy, with fares covering not only operating costs but most or all debt servicing costs as well. By doing so, a private company could build and operate the light rail line at no or little cost to the taxpayer.
“The rest is history” as they say and the SkyTrain Millennium Line was built instead and is subsidized by over $100 million annually!
The Light Rail Committee Proposes the BCIT to UBC and Stanley Park Light Rail Project.
In late 1996 the Light Rail Committee (now defunct) proposed a bold Broadway light rail plan: a tram/light rail line from BCIT to UBC via the Lougheed Hwy., Broadway, 10th Ave. and University Blvd. with a second line via Main street to Hastings Street to the Aquarium in Stanley Park. The plan consisted of lawned reserved rights-of-ways and on-street running; priority signaling on traffic calmed Broadway and Hastings Streets; tram/streetcar stops every 500 metres; a single track Vancouver General Hospital Loop via Fraser St., 10th Ave. and Cambie St., providing front door service to the hospital.
Commercial speed would be about 20 kph to 25 kph (depending on the number or tram-stops per km.) and the construction costs in the region of $35 million/km to $45 million/km; with maximum hourly capacity more than double the Millennium Line’s maximum capacity of 7,500 pphpd after a $1.47 billion re-signalling program!
In Finland a recent (2025) 3.9 km extension to a tramway cost CAD $34.1 million/km to build!
The value of the Petržalka contract is €83.043.464 (CAD $133 million(no VAT). This works out to $34.1 million/km. Compare the current cost of the 5.7 km, $3.5 billion extension to the Millennium Line to Arbutus (Broadway subway) at over $600 million per km, for the same cost of 5.7 km extension to the Millennium Line, we could build over 100 km of modern European Tramway!
Signaling would be line of sight with intersections and switches protected by local signaling. Headway’s could be as low as 60 seconds in peak hours.
What the LRCs plan would do is service many important transit destinations (UBC, BCIT, VGH, downtown Vancouver, Stanley Park, etc.), while providing economy of operation by replacing all bus services on Broadway and many in Vancouver, thus reducing operating costs by about half. Further economies are made by using existing masts and span wires along the proposed transit routes. The new LRT would be merely seen as the reinstatement of streetcar service by modern articulated trams, operating on 21st century rights-of-ways.
The concept of a private operator, by securing private financing to build the line at no or little cost to the taxpayer must be looked at by politicians. This type of P-3, not to be confused with the Canada Line scam, would see little or no subsides from government, unlike the Canada line which is heavily subsidized by TransLink by over $110 million annually.
The plan would reduce Broadway to one lane of traffic in each direction (passive traffic calming) except in areas of mixed operation, while keeping the all important on-street parking for local merchants. The plan would have offered a minimum of three transit routes: BCIT to UBC; BCIT to Stanley Park; UBC to Stanley Park.
The plan incorporates modern European light rail and tram practice; lawned reserved rights-of-ways, modular cars, high capacity, passenger comfort, and affordable cost.
It was not to be, as the Glen Clark NDP government, for reasons that can only be speculated, dismissed LRT out-of-hand and went for the then obsolete and hugely expensive Advanced Rapid Transit (ART) system, the fourth renaming of what is generally called SkyTrain.
The City of Vancouver and TransLink are demanded and got $3.5 billion dollar subway under Broadway, basically to serve their belief that “subways make a city world class”.
It is time to again to consider again a BCIT to UBC and Stanley Park light-rail network, that could cost the taxpayer little or no money instead of a $3.5 billion subway to Arbutus or a $8 billion plus subway to UBC that ignores transit concerns East of commercial Drive.
First posted by zweisystem on Tuesday, November 17, 2020 (updated)
I am reposting this from November 2020 because TransLink, civic and provincial politicians are singing hosannas about Bus Rapid Transit, with some going so far to say that BRT makes light rail obsolete!
What is damning today is that the numbers used in TransLink’s 2019 study for transit options are random, pulled out of the air.
Today, according to Thales, who has won the $1.47 billion resignalling contract for the Expo and Millennium lines, the present maximum capacity of the Millennium Line is a mere 4,000 persons per hour per direction and after resignalling, the maximum capacity of the Millennium Line will be only 7,500; far less than the numbers used in the study.
Not only does this call into question the validity of this study, but the validity of every study offered by TransLink to date!
It is a given, that TransLink has very serious financial ills mostly stemming from the $16 billion cost of the full program to extend the Expo and Millennium Lines (Broadway Subway) 21.7 km. As always, the provincial government, the Mayor’s Council on Transit, and TransLink are cowards when it comes to telling the truth about transit and continue to do the same thing over and over again, pretending that are doing it right …… this time.
They are not.
It verifies what we all knew: that TransLink underestimated the capacity of surface rail by 150% and the time penalty by infinity.
Professor Patrick M. Condon, James Taylor Chair in Landscape and Livable Environments, UBC
Yes we all knew. American Transportation Expert, Gerald Fox told us in 2008:
The Evergreen Line Report made me curious as to how TransLink could justify continuing to expand SkyTrain, when the rest of the world is building LRT. So I went back and read the alleged Business Case (BC) report in a little more detail. I found several instances where the analysis had made assumptions that were inaccurate, or had been manipulated to make the case for SkyTrain. If the underlying assumptions are inaccurate, the conclusions may be so too.
We were also warned about ALRT (SkyTrain) back in the early 1980’s!
Our politicians, academics, and the mainstream media knew, but did not heed, either blinded by gadgetbahnen envy or were too easily bought and thus continues the planning charade that has so distorted our regional transit planning today.
Tram Capacity to UBC has been grossly understated:
Given the characteristics of the tram’s exclusive lane corridor listed above, a 2.5 minute headway is achievable. This is roughly 60% more practical capacity than a 4 minute headway.
Let us also remember:
The Millennium Line’s legal capacity, as per Transport Canada’s Operating Certificate is 15,000 pphpd. Please note:According to Thales 2022 News Release regarding their winning a $1.47 billion resignalling contract of the Expo and Millennium Lines; ““When the programme is fully implemented, the Expo Line will be able to accommodate 17,500 passengers per hour per direction, and the Millennium Line (Broadway Subway) will be able to handle 7500 passengers per hour per direction, a 32% and 96% increase respectively.” This means the current maximum capacity of the Millennium Line (Broadway Subway) is 4,000 pphpd!After resignalling, the Millennium Line will still have less capacity than what streetcars were carrying 75 years ago!
In the 1940’s and 50’s Toronto’s Bloor Danforth streetcar line operated coupled sets of PCC cars, offering a capacity of 12,500 pphpd.
In Karlsruhe Germany, because of the success of TramTrain was seeing peak hour capacity of in excess of 30,000 pphpd.
Who says, LRT has less capacity than SkyTrain?
The Gelbe Wand or Yellow Wall of trams in Karlsruhe, Germany
As Gerald Fox summed up:
It is interesting how TransLink has used this cunning method of manipulating analysis to justify SkyTrain in corridor after corridor, and has thus succeeded in keeping its proprietary rail system expanding. In the US, all new transit projects that seek federal support are now subjected to scrutiny by a panel of transit peers, selected and monitored by the federal government, to ensure that projects are analyzed honestly, and the taxpayer interests are protected. No SkyTrain project has ever passed this scrutiny in the US.
******************************************
Background
In the Jan 2019 UBC transit report1, we see the demand forecast for transit options of Bus Rapid Transit (BRT), Light Rail Transit (LRT or street-running tram) and RRT (skytrain or ‘light-metro’). It is clear from the two pictures below, that RRT is the ‘winner’ or preferred option (as represented in the Jan 2019 report):
As an explanation to the charts immediately above, the 2019 report explains:
“ LRT ridership is forecast at about 60% that of RRT, partly because of slower travel times and the transfer penalty, but also because of capacity limitations. The increased speed, reliability and capacity of RRT attracts more ridership from latent and suppressed demand and better serves total demand along this corridor.”
According to the Jan 2019 study1, because of the following, RRT is the only suitable option for transit to UBC..
Travel times,
Transfer penalty
Capacity
It will be shown that the largest of these factors affecting LRT ridership is capacity. For this reason, this paper discusses the capacity limitation newly introduced by the 2019 study1, that was not a limiting factor in the 2012 study2 and why it is not correct.
The following is from our transit specialist in Ottawa.Mr. Haveacow, commenting on the post and is very informative.
The frustrating thing about the way Translink measured the capacity ranges for the various types of rapid transit technologies was because it was based on how they believed they would run the particular transit operating technology. It wasn’t based on how other more experienced regional transit properties ran their facilities or even close to the best-known Canadian or international operating practices of each type. This pretty much guarantees the results you want. The choice of Skytrain on Broadway was highly manipulated by this kind artificially low operational capacity and standards and practices that were poor choices for any comparison. I used Bus Rapid Transit as an example here not because I thought it was the best option on Broadway but as an example to show how poorly Translink’s BRT option really was compared to what could have been used in their report.
The Bus Rapid Transit norms used were inferior and far from the superior practices used by Ottawa and other cities.This absolutely shoddy choice of BRT infrastructure and operating practices shows the limited understanding Translink officials had on the subject. Thus it’s not surprising that the capacity limits believed for their BRT comparison were more than a little artificially low, especially compared to where and how they planned to operate the Skytrain.
How Translink Defined and Would Operate Bus Rapid Transit
I remember reading what Translink defined as Bus Rapid Transit in many of their past reports and giggling. Ottawa has operated real Bus Rapid Transit on our bus Transitway Network since 1983. Ottawa still has the most extensive network of BRT lines in North America, even with 12.5 km of BRT lines already converted to LRT and about 25 km more being converted presently. Many of the operating details of what Translink defined under BRT would be laughed at by longtime Ottawa Transitway passengers and not considered BRT but really, a glorified express bus with nice bus stops.
Professionally, many of the operating practices presently used or what Translink planned to use as BRT operational practices in their reports, showed at best an inexperienced operator and a lack of understanding about what you can really do with BRT. If you are going to measure BRT against Skytrain in a given corridor to determine the most useful operating technology, actually measure a real functioning line that is working within a real BRT operation. Not the joke Translink used to compare against the Skytrain. What was obvious from the start was that Translink doesn’t either understand or wouldn’t acknowledge that there are 2 main types or extremes, of BRT operations, open or closed systems. Choosing to mainly concentrate on either one has real operating advantages depending and different issues that very much effect what gets put in reports. Unfortunately the same lack of understanding can be said for their LRT and just general standard bus operating comparisons as well.
The example of BRT system Translink used was a mostly closed system which by their nature purposely limits operational capacity and bus numbers to preserve the infrastructure’s theoretical capacity. It greatly lowers cost as a result but Translink’s own documents downplayed the cost reality. It mainly concentrated on the capacity argument. The examples below are mostly open BRT systems which greatly increase operational capacity.
Before the conversion to LRT, during the height of both the AM and PM peak period, Ottawa’s Transitway would have a passenger level of 10,700 passengers per hour per direction. This was done using 185 to 200 buses per hour per direction on 85 seperate bus routes. During the day the Central Transitway would average between 4,000 to 6,000 pass/hr/direction using 60 to 80 buses/hr/direction.
Currently, during both peak periods Gatineau’s Rapi-Bus Transitway moves 4600 to 5000 pass/hr/direction using 90 to 100 buses/hr/direction.
Brisbane, Queensland, Australia “Brisbane Transport Agency known as “Translink” operates a successful BRT “The Busway Network” moves at peak 14,000 pass/hr/direction using 225 buses/hr/direction.
Pitsburgh’s Busway Network during both peaks sees 4500-4800 pass/hr/direction using 90-95 buses/hr/direction
Capacity and Cost is Important Here
The capacity of Translink’s BRT example in the report shows a service level of only a marginal improvement over the current bus system. Each one of these BRT examples I used uses far greater levels of buses than was currently planned for the Broadway Corridor, but their capacity far exceeds stated capacity levels of Bus Rapid Transit in the reports. The truly laughable BRT capacity used by Translink here can’t be realistically compared against a full Light Metro line operating in a tunnel. Especially if operating costs aren’t considered important. For example, data out of various projects in Montreal, Toronto and Ottawa all showed that a full scale BRT line is lower in cost per passenger and 30 year operating costs than a Light Metro line if that particular line is moving less than 134,000 people a day. Broadway has quite a while before it will consistently break that service level.
Compare Apples to Apples and Oranges to Oranges
The BRT example used in the Broadway report was mostly operating in a painted bus lane with some physical segregation. Painted bus lanes can be easily entered by other vehicles, they are almost impossible for any police service to regulate if it is more than a kilometre long, are highly effected by parking lanes, driveways and laneways, block lengths, the number, size, frequency of and types of intersections. Different types of intersection signaling and control and the sheer number of other lanes. Painted bus lanes have a very low numerical capacity 3000 to 5000 pass/hr/direction depending on many physical conditions. Lastly, the amount of external traffic is desperately important as well for the operating effectiveness of a painted bus lane. Unless the bus lane is a non painted, physically segregated from other traffic, the comparison of this bus lane to any train in a tunnel is meaningless.
To be fair, if you are going to measure a BRT lane against a Skytrain operating in a tunnel, the BRT lane needs to be in a tunnel as well!
The type of BRT operations used needs to have the capacity maximized to compete fairly against any type of train. The position of the BRT lanes also needs to be considered as well given other surface road conditions.
A mostly closed BRT system operating along mainly painted bus lanes, operating in the open, along with other mixed traffic lanes and having to enter signalized intersections will never compare favourably against the Skytrain operating below grade in a tunnel.
Stations become critical here because the report had fairly numerous bus stops that could only hold two articulated buses 18 to 20 metres long each. The Skytrain station platforms were 80 metres long. There were also more BRT stops than Skytrain Stations. That’s just not an equal comparison!
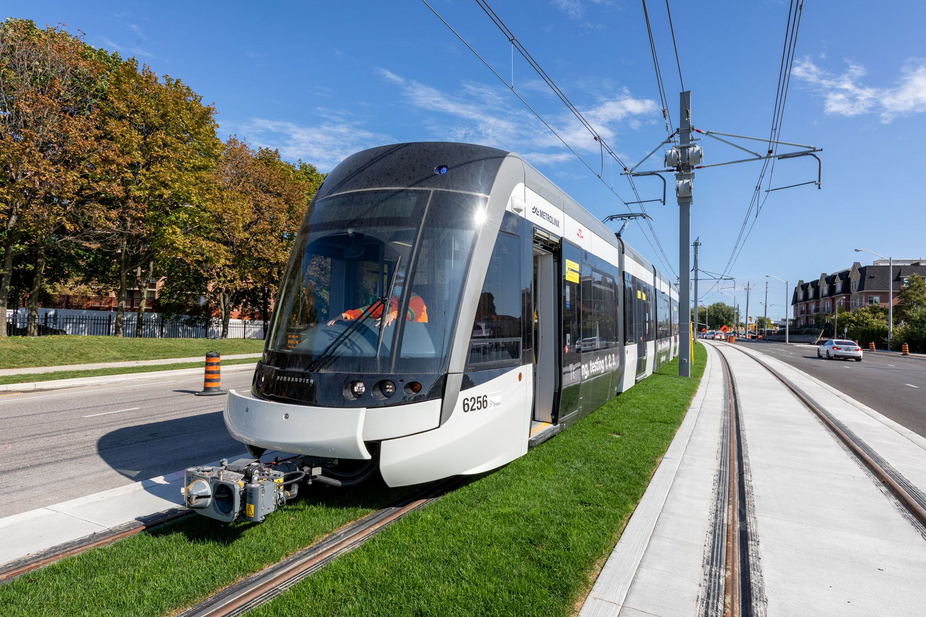


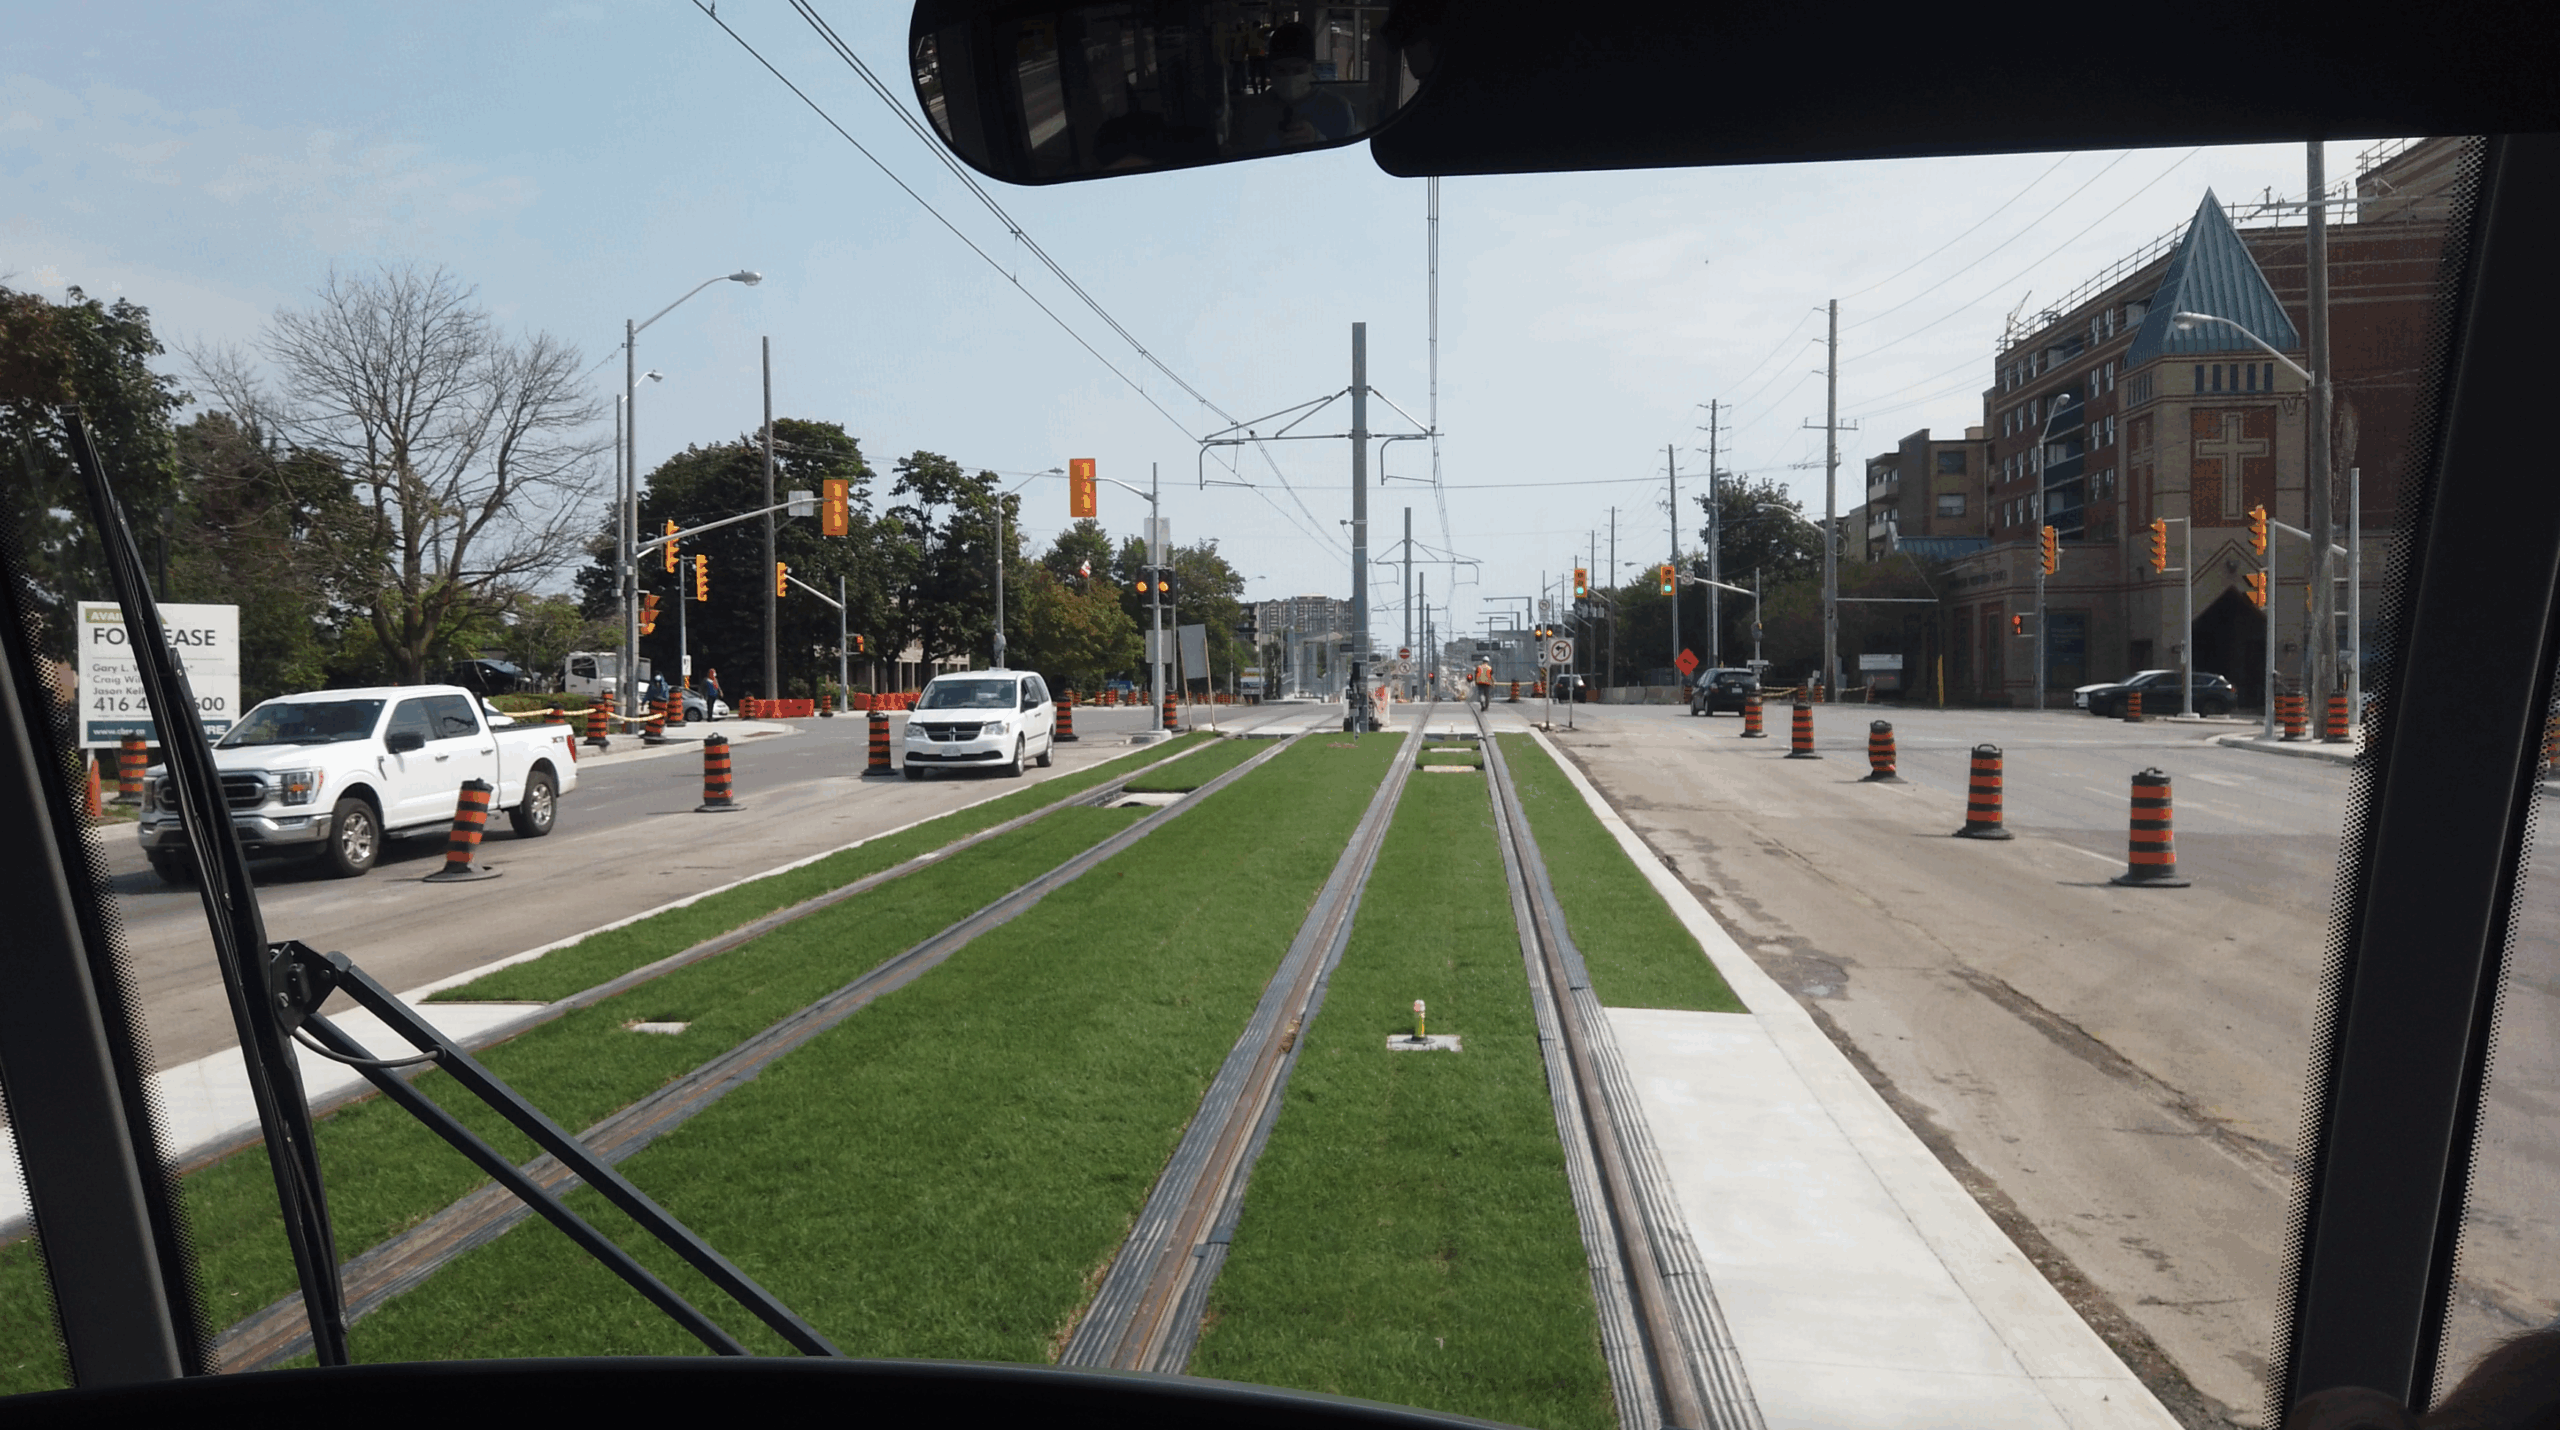


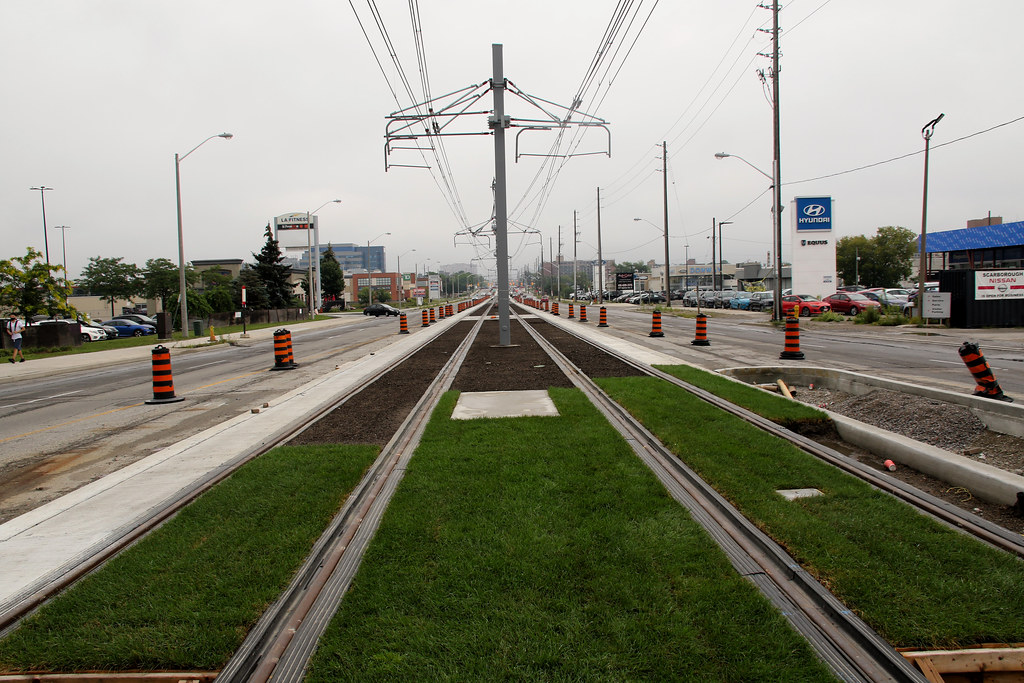
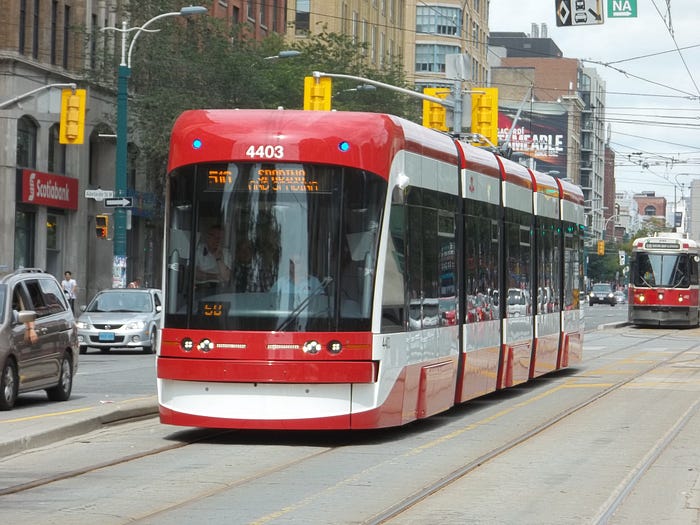
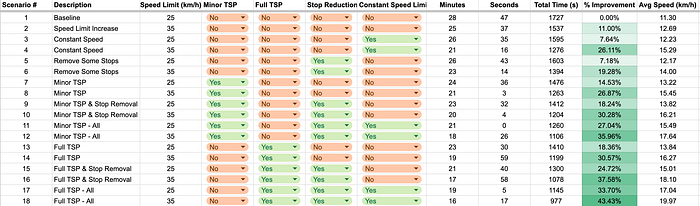


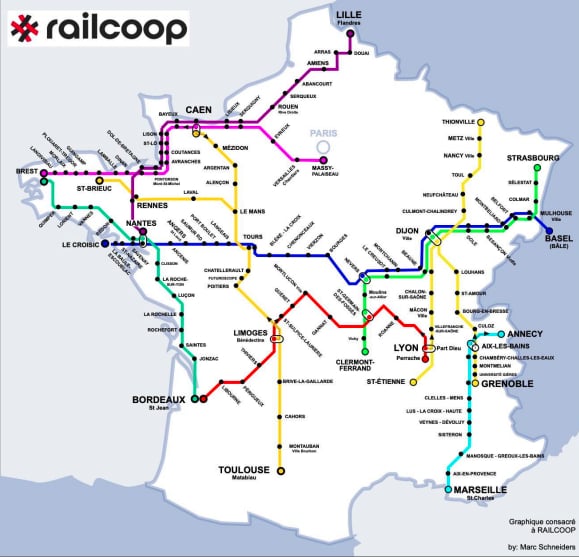
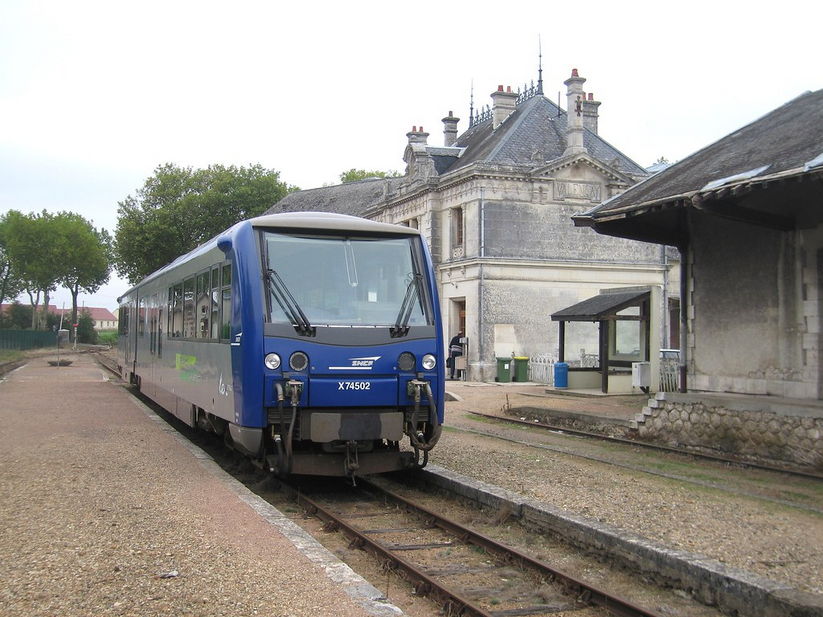


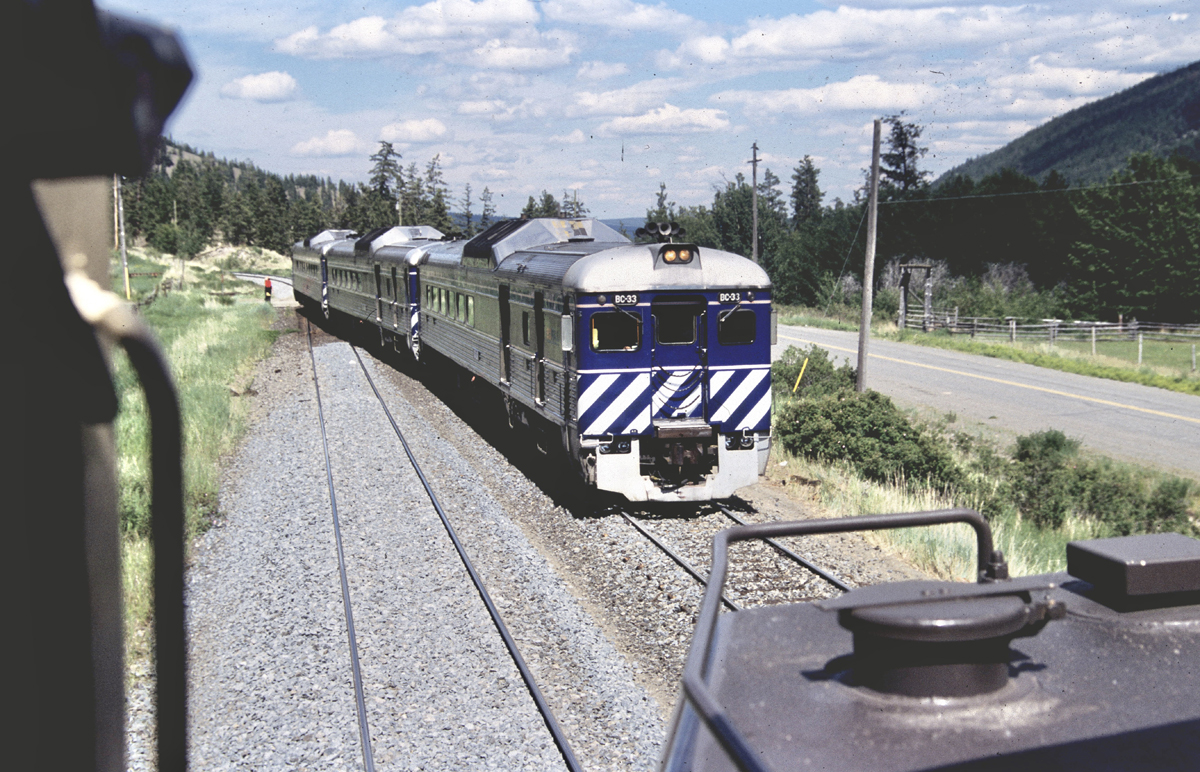


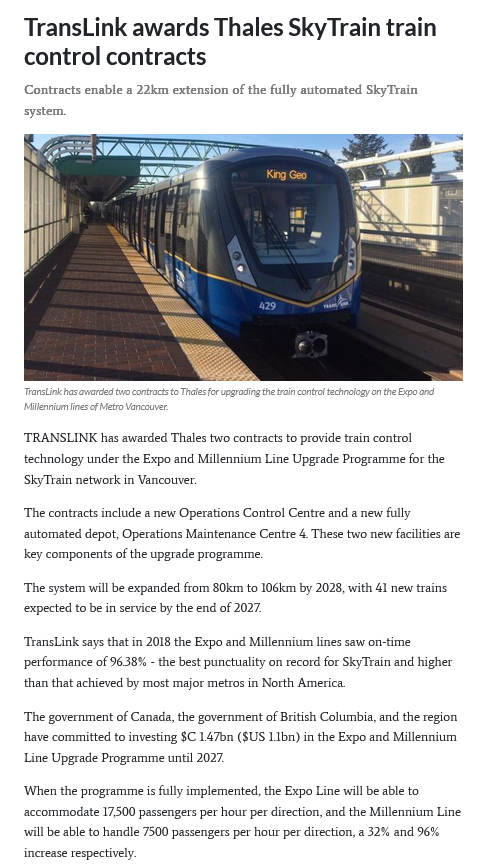


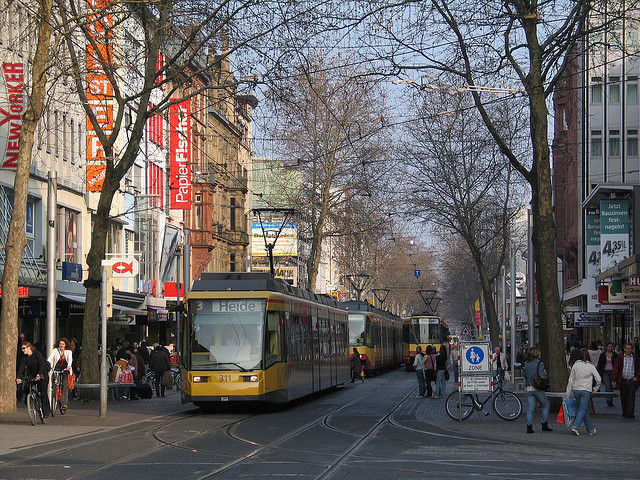


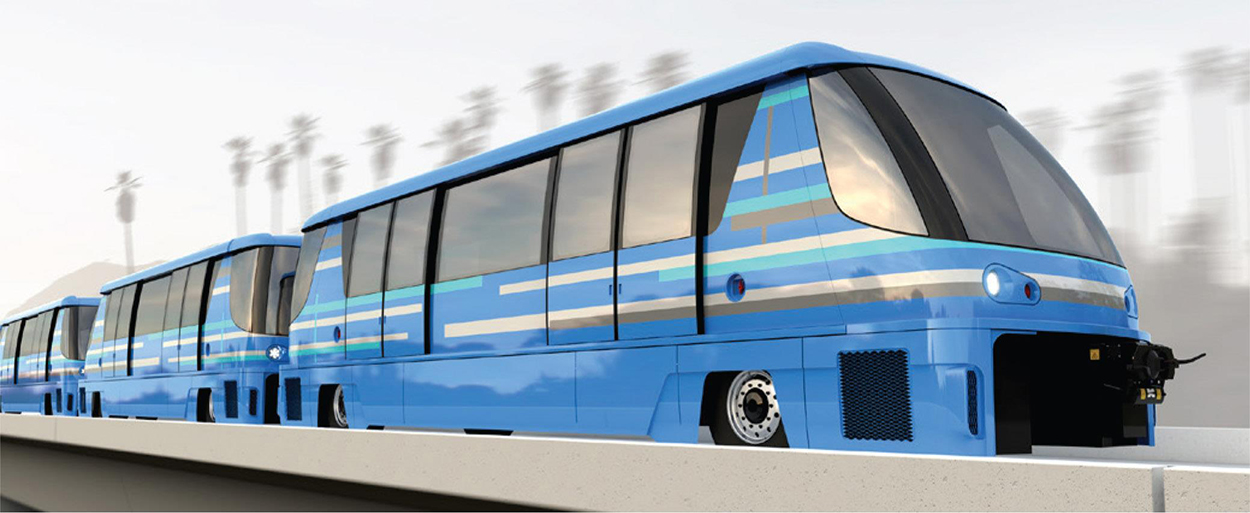
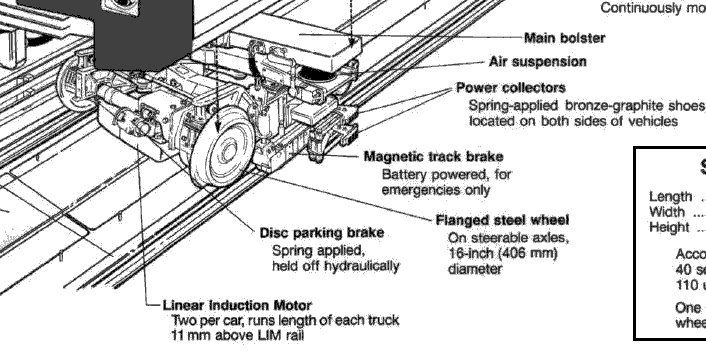
Recent Comments