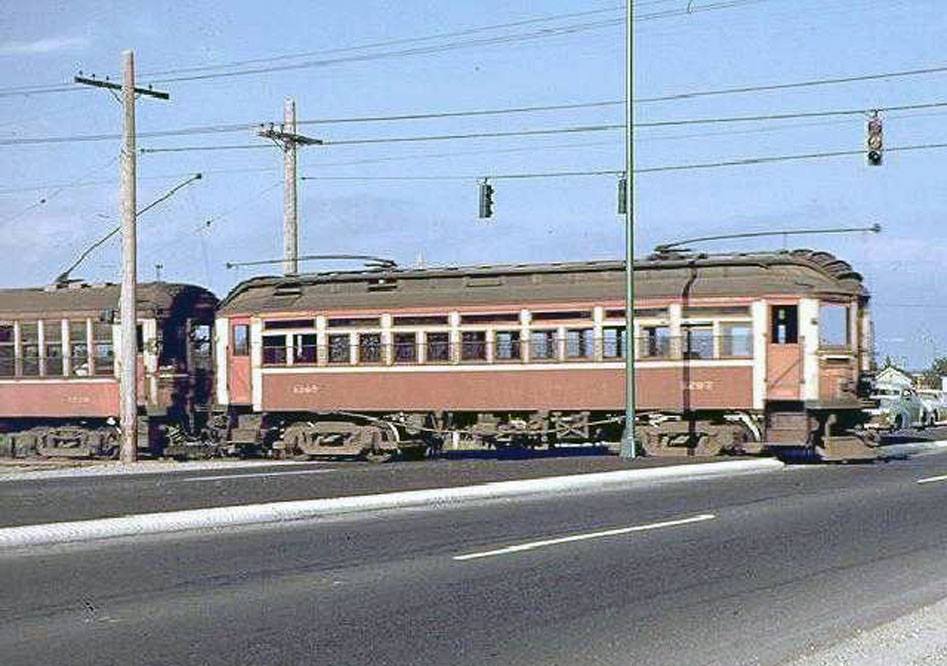
This picture of a pair of BC Electric interurbans has intrigued me, where is the location that this photo was taken?
It seems it is a single track crossing a four lane road with a tarmac median. If so, then it is not the Arbutus or Central Park Lines.
I do not think it is in Richmond, having spent the first seven years of my life in Richmond I do not recall any four lane roads, let alone any with a tarmac median.
The second auto in the picture looks like early 50’s (52 or 53), so the picture is near the end of operation.
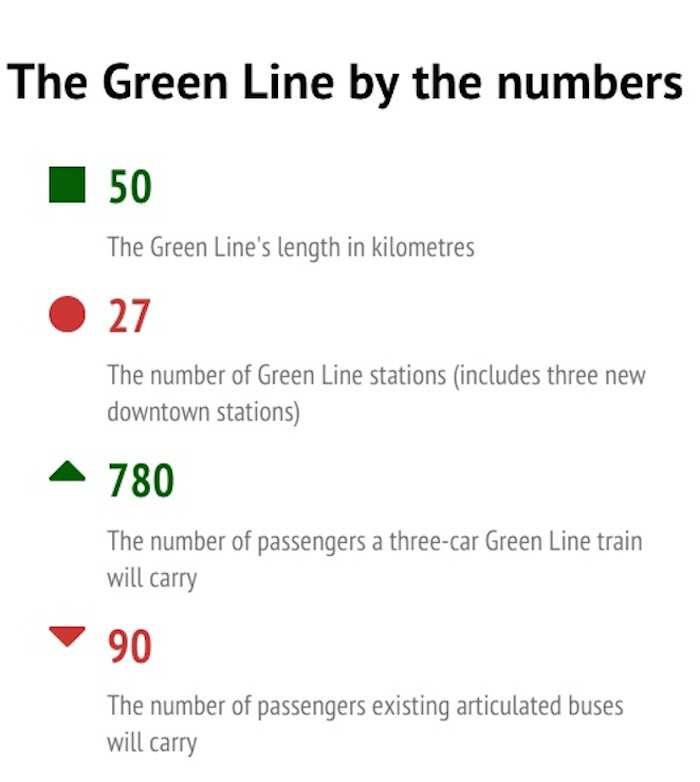
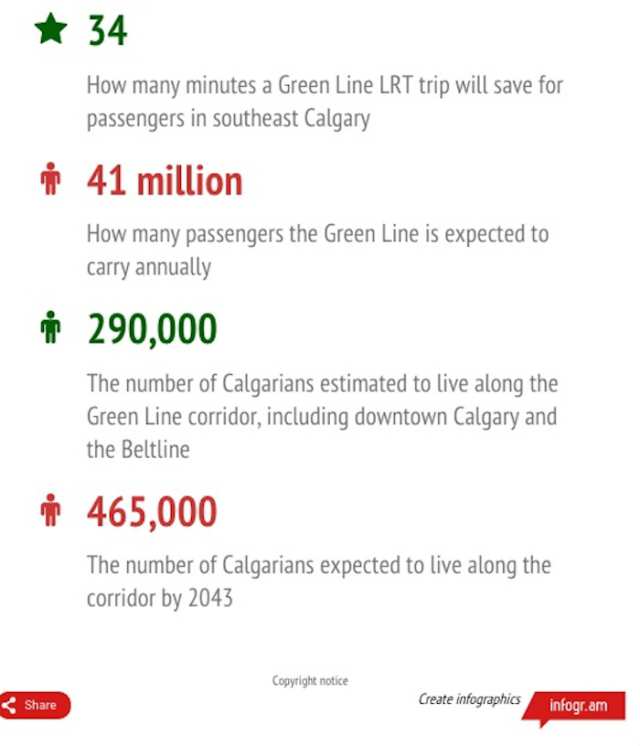
The Calgary C-Train will almost double in size after the Federal Government’s gift to pay one third the cost of construction. The 60 km network will expand to 110 km with the 50 km Green Line.
The large cost for the new LRT line will be, in part I believe, is due to a subway built under Calgary’s downtown and the high cost of land expropriation, though I wonder if last year’s floods might have changed some minds about the need of subway construction.
We also must remember that Calgary’s LRT was built more along the lines of a German S-Bahn than modern European style LRT, with long stretches of dedicated rights-of-ways with on street operation in the downtown, with articulated high floor cars.
Calgary gets $1.5 billion from federal government for construction of C-Train Green Line
By Dave Dormer, Calgary Sun First posted: Friday, July 24, 2015
Calgary’s LRT system will double over the next decade thanks to $1.53 billion in federal funding announced Friday for the proposed Green Line.
The money represents one-third of the total cost of building the Green Line — slated to run from Country Hills Blvd. in the north to Seton in the southeast.
Mayor Naheed Nenshi said the current plan is for construction to begin in 2017 with completion slated for 2024.
Calgary Southeast MP Jason Kenney,Ai?? regional minister for Southern Alberta, minister of national defence and minister for multiculturalism, called it the single largest federal infrastructure investment ever in Alberta.
Strange that, after the resounding NO vote in the recent plebiscite, the Vancouver Sun has been giving ink to some very pro LRT writers, in both the Op-Ed section and the Letters To The Editor Section.
Saturday, July 18: Portland LRT grounded in reality
Vancouver Sun July 17, 2015
Letter writer Ray Arnoldai??i??s decision to vote No in our recent transit plebiscite was due in part to his transit experiences in Portland (pictured), Seattle, and San Francisco, where, he says, ground-level light rail has proven to be immensely cheaper and equally, if not more, efficient than subways, more effective in building community cohesion, and less detrimental to traffic control and business than our so-called experts claim would be the case here.
Photograph by: Handout Ric Ernst, PNG
One of the fun things about visiting Portland is how easy it is to navigate around the city on the light rail transit system.
No walking up and down stairs or riding elevators or escalators to elevated or underground stations. Simply wait at a street-level transit stop and step on board.
While on board, you can check out the neighbourhoods you are passing through or hop off to visit an interesting store or restaurant you just passed. Itai??i??s a more civilized and enjoyable experience than riding the Canada Line and at a cost of $40 million per km to build compared with subways at $250 million per km, itai??i??s clear Portlandai??i??s politicians and administrators have made more enlightened and responsible decisions for their taxpayers than ours have and were going to make for us.
My decision to vote No in our recent referendum was due in part to the transit experiences I have had in Portland, Seattle, and San Francisco, where ground level light rail has proven to be immensely cheaper and equally, if not more, efficient than subways, more effective in building community cohesion, and less detrimental to traffic control and business than our so-called experts claim would be the case here.
Congratulations No voters ai??i?? you recognized incompetence at work and responded accordingly.
Ray Arnold, Richmond
Portland MAX LRT
Fact file
2A?-Hour Ticket
1-Day Pass
7-Day Pass
14-Day Pass
30-Day/
1-Month Pass ai??i??
1-Year Pass ai???
Adult
$2.50
$5
$26
$51
$100
$1,100
Honored Citizen
(ages 65+/disabled/medicare)
$1
$2
$7
$13.50
$26
$286
Youth
(ages 7ai??i??17 or high school/GED students)
$1.25
$2.50
$7.50
$14.50
$28
$308
Children
(ages 0ai??i??7)
Free when accompanied by fare-paying passenger
Notes:
ai??i?? 30-day passes are sold at ticket vending machines at MAX stations, while passes valid for a single calendar month are sold at TriMet ticket outlets.
ai??? 1-year pass can only be purchased at TriMet’s Pioneer Square office.
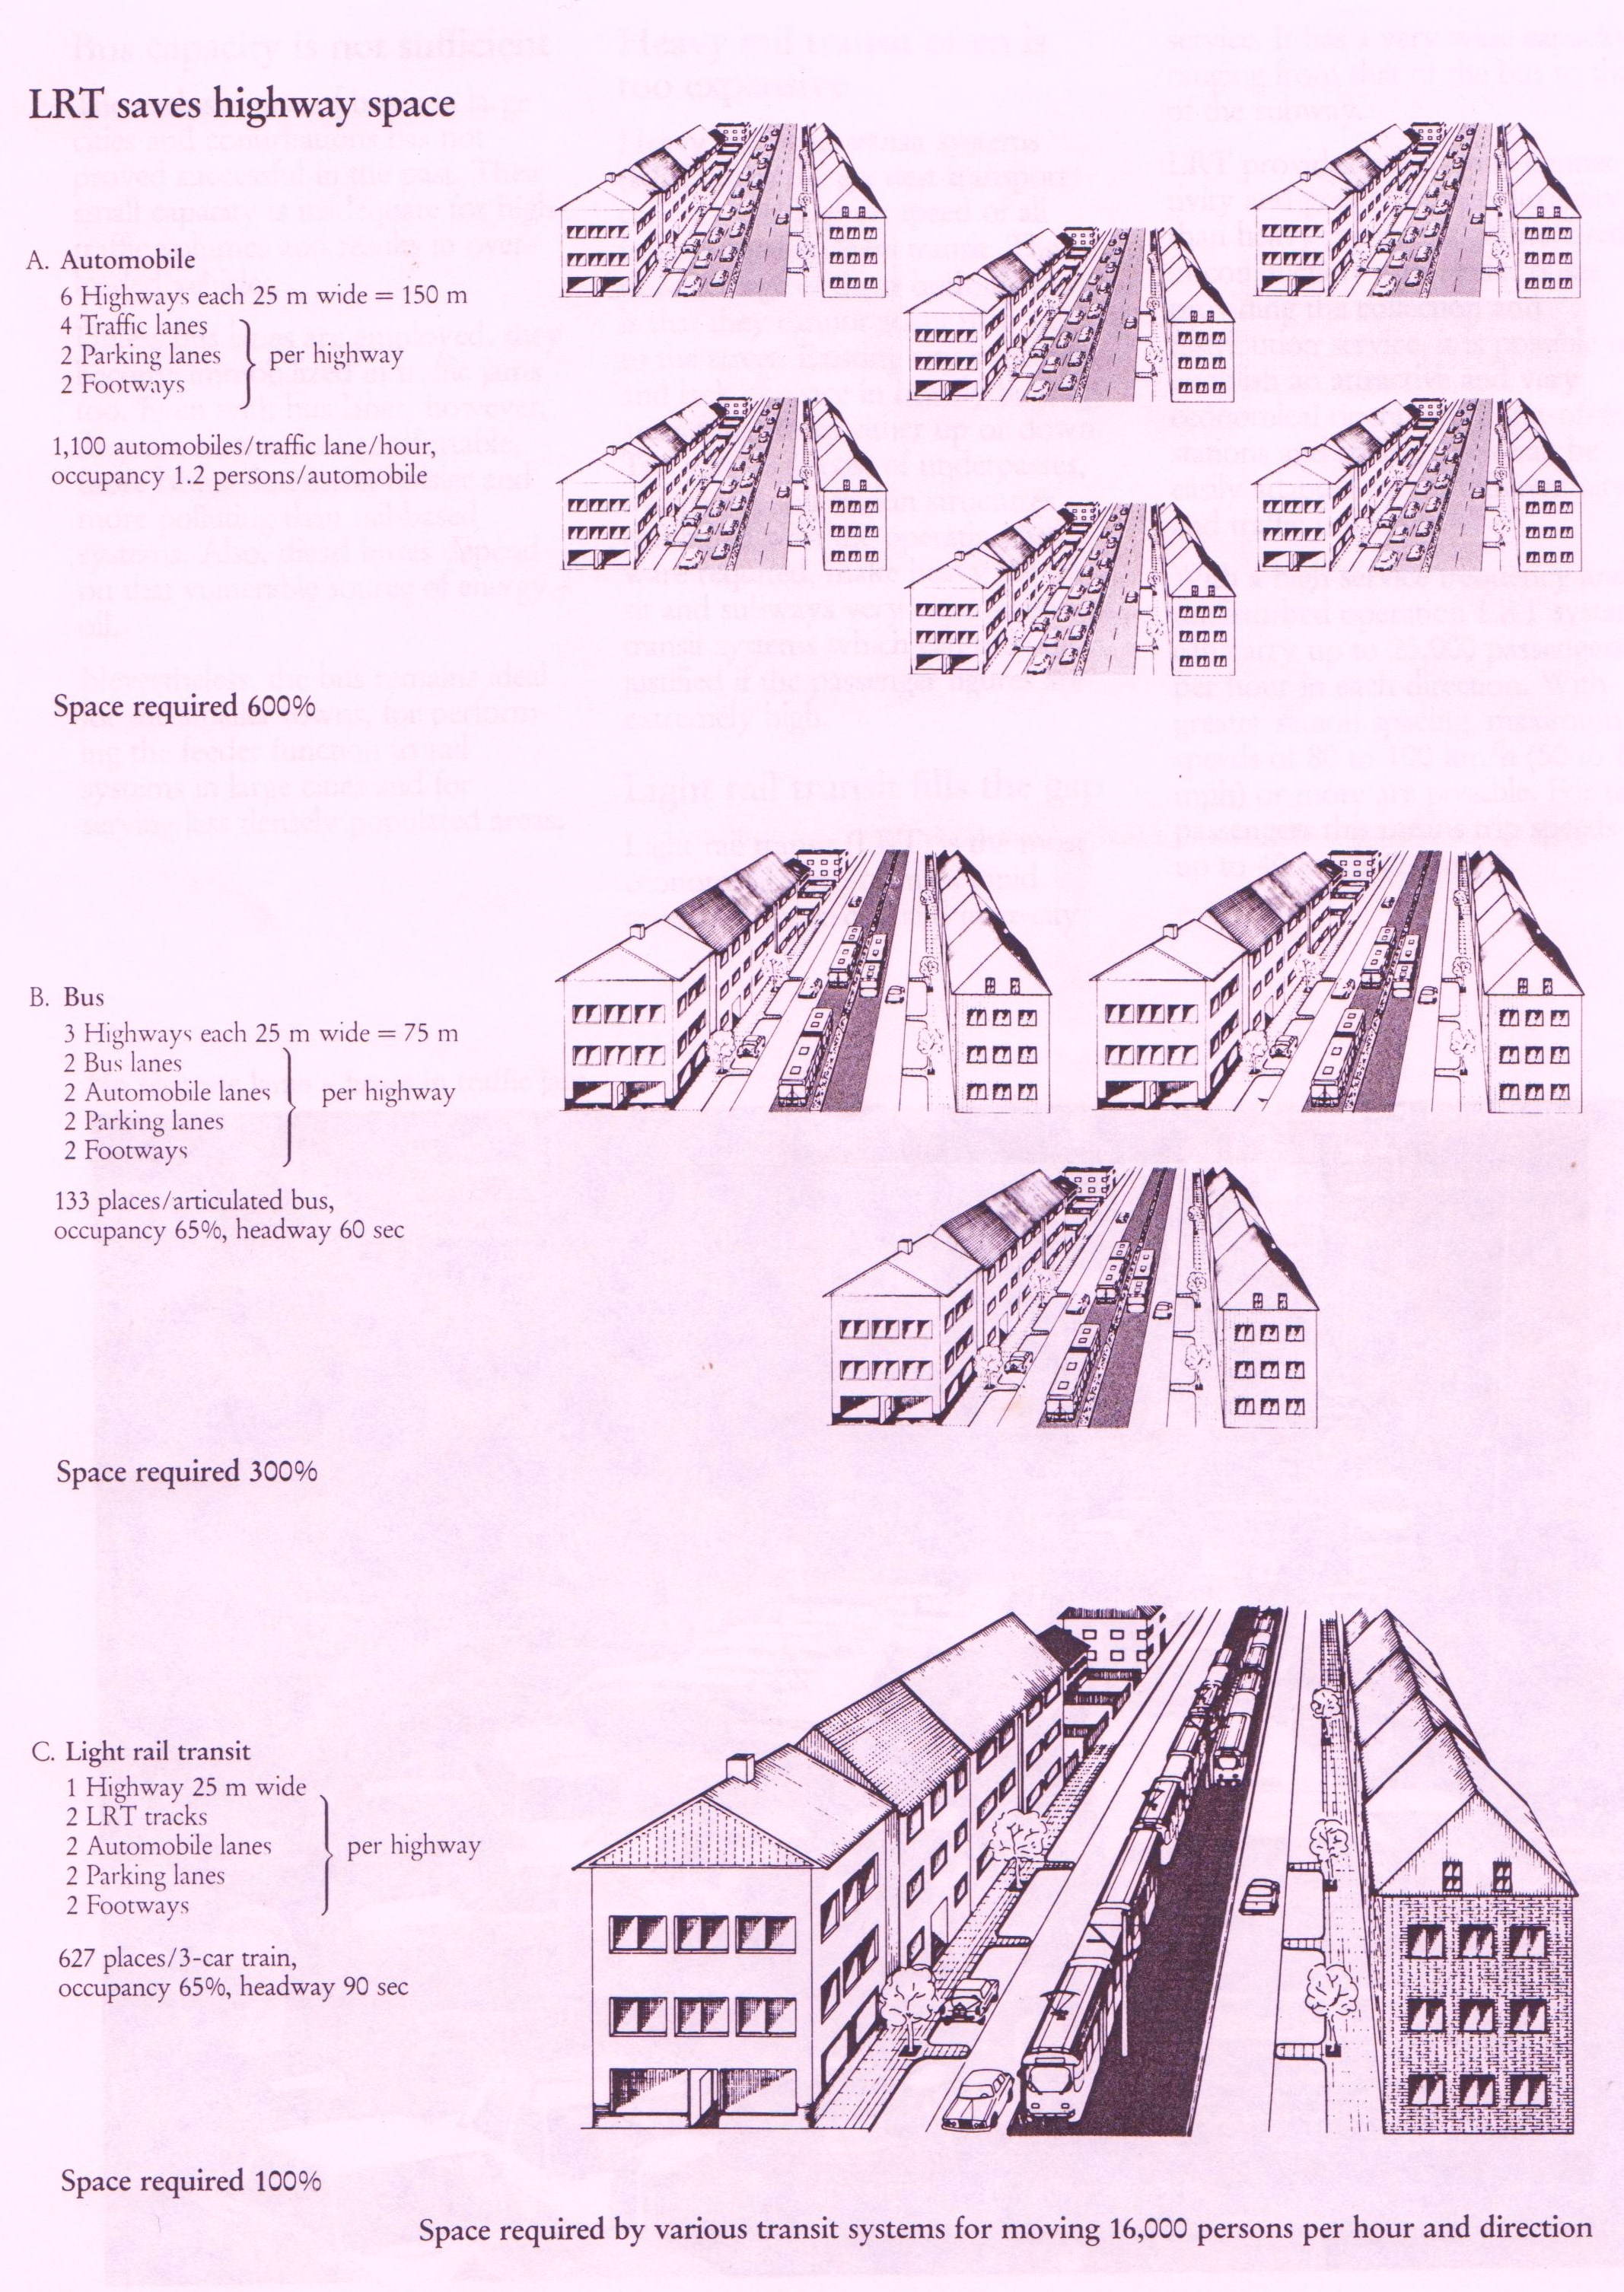
This is from a Siemens promo for light rail from the 1980’s.
Self explanatory, it gives a good visual how modern LRT saves highway space. It also shows that modern LRT could be built on Broadway and still provide road space for autos and with parking.
Light Rail is a streetcar that operated on a reserved rights-of-way.
The resounding NO vote has changed the tune, somewhat, of the Vancouver Sun’s reporting of regional transit issues. How long this will last is anyone’s guess.
Zwei voted no because I thought the plan was unworkable; a $3 billion subway from Glen-Clark Station to Arbutus and a $2 billion plus LRT to nowhere in Surrey, seemed at first glance, bizarre and very expensive for what it will do.
Upon further research, the Broadway SkyTrain subway, was nothing more than the original provincial promise to induce former GVRD Chair, George Puil to get GVRD agreement for the Millennium Line. To get the GVRD on board with the NDP’s flip-flop from LRT to SkyTrain, the Glen Clark Government promised to create a GVRD controlled TransLink, regional transit authority, and to fund two thirds of SkyTrain only construction West of Commercial Drive. Plans of the time show the subway terminating at Arbutus.
The proposed Surrey LRT is nothing more than the fifty year plan for SkyTrain development in the municipality, instead using LRT, thus making Surrey’s LRT a poor man’s SkyTrain.
Bad transit planning all around and it is refreshing that Ms. Murphy does indeed ‘get it’.
Now, let us get on with plan B, a Vancouver to Chilliwack TramTrain!
Opinion: Transit plebiscite vote was a rejection of TransLink’s plan
Look at more affordable transportation options to cover more of the region is needed
By Elizabeth Murphy, Special to The Vancouver Sun July 13, 2015
At $40 million per km, light rail is more affordable than the $250 million per km cost of subways, some say.
Photograph by: Richard Bergeron
The 62 per cent No vote result in the transit plebiscite was not simply a rejection of the sales tax or a renunciation of TransLink; it was, more important, a rejection of the plan generally.
Improvements to Lower Mainland transit is an urgent requirement. We need to learn from this plebiscite and establish a supportable plan with a funding model.
The areas of the region with the highest No vote are those that would benefit the least and also have the greatest transit infrastructure deficit.
The plan was also rejected in Vancouver. Although it had the biggest ticket item, the Broadway subway, putting most of the resources into only one corridor, with the huge tower development that would follow, is a mistaken direction that needs to be reconsidered.
Rather than a few mega-project corridors, we need to look at the transit network as a whole. If the transit resources were more broadly distributed using more affordable technology, benefits would be achieved throughout the region.
The city of Vancouver was initially planned and built before general use of the automobile. It was laid out as a transit-oriented city, having everyone within a five- to 10-minute walk of an arterial to access transit.
Improving service on all arterial routes would achieve much broader benefits at a significantly lower cost. The most cost-effective electric technology is the trolley bus. Most of the infrastructure exists already in the city. It could be expanded and improved as a clean, quiet transit system. Some areas would also support streetcars since the city was originally designed for streetcars.
There should also be interurban routes to the suburbs, as in the early pre-automobile days. Many of the rail rights of way still exist.
Comparing costs:
ai??? Subways are $250 million per km;
ai??? Streetcars and light rail are $40 million per km; and
ai??? Electric trolley buses only $1 million per km plus additional double articulated buses at $1 million each.
The more affordable options could cover more of the region at a fraction of the cost.
The more affordable options also tend to have negligible negative effects on established neighbourhoods. Part of the public pushback is the idea of putting towers at every station. This may be appropriate downtown, but planning Metrotown-scale development through neighbourhoods such as Kitsilano and Point Grey is a non-starter.
Even if the Broadway subway funding had been approved, it would not have been built for decades. However, the immediate up-zoning that allows increases in what could be built along the Broadway corridor would have added to congestion. The proposed tower development is the most problematic part of the plan.
This scale of development is also unnecessary to meet growth projections. Vancouver city council recently accepted a staff report that included a Coriolis Consultants report stating: ai???The city has sufficient capacity in existing zoning and approved community plans to accommodate over 20 years of supply at the recent pace of residential development.ai??? It further says little of the rezonings since 2009 have been built out to date.
That report only includes rezoning to 2013. So all the rezoning to date, the current planning processes underway (for example, Grandview community plan or Jericho), as well as up-zoning on the Broadway corridor if it is approved, would be over the existing zoned capacity calculated in the report. The premise that more up-zoning is required for supply to meet regional obligations for growth is false, according to the Coriolis report.
Perhaps it is time to ensure there is enough electric transit capacity to support what we already have zoned rather than planning for more development than is sustainable.
Using transit technology that is more affordable can benefit the region as a whole and therefore gain broader support for the plan. Our existing SkyTrain lines need investment and upgrades which should be funded before new expensive subway lines are added.
For funding models, the mayors are correct in demanding the province fulfil its obligations to fund transit rather than downloading the expense to the civic level. Property taxes and development fees should be taken off the table as transit funding sources. Carbon taxes and gas taxes make the most sense.
TransLink governance needs to be returned to the regional level, as it was before its reorganization in the early 2000s into the dysfunctional and undemocratic mess it has become. Then it will need to be properly and fully funded by the province, based on a more realistic plan to service the region with clean and affordable electric technology.
It is time to create a transit plan and funding model that is democratic, affordable and popularly supported.
Elizabeth Murphy is a private-sector project manager and was formerly a property development officer for the City of Vancouverai??i??s Housing & Properties Department and for B.C. Housing.
With the resounding defeat of the YES side in the recent plebiscite, maybe it is time to dust off the Leewood/Rail for the Valley Study. The simple fact is, other groups are, without acknowledging the massive efforts Rail for the Valley has invested in this project, trying to take credit for a plan B!
The Leewood/Rail for the Valley Study could be a good compromise for a “Plan B”, sinceAi?? the failure of of the TransLink/mayors Plan plebiscite.
A Chilliwack to Vancouver TramTrain service could be just the ticket to bring credibility back to Metro Vancouver, the regional mayors and TransLink.
A modified Leewood plan could see an thirty minute service (a train every 30 minutes) from downtown Vancouver to Chilliwack, using FRA approved Stadler diesel LRT vehicles.
An updated cost of $1 billion would include double tracking and improved signalling on the shared Roberts Bank Railway tracks; longer sidings and passing points at strategic locations along the line, and double tracking the line through the Grandview cut. By using diesel LRT, would enable more money to be invested on track and infrastructure.
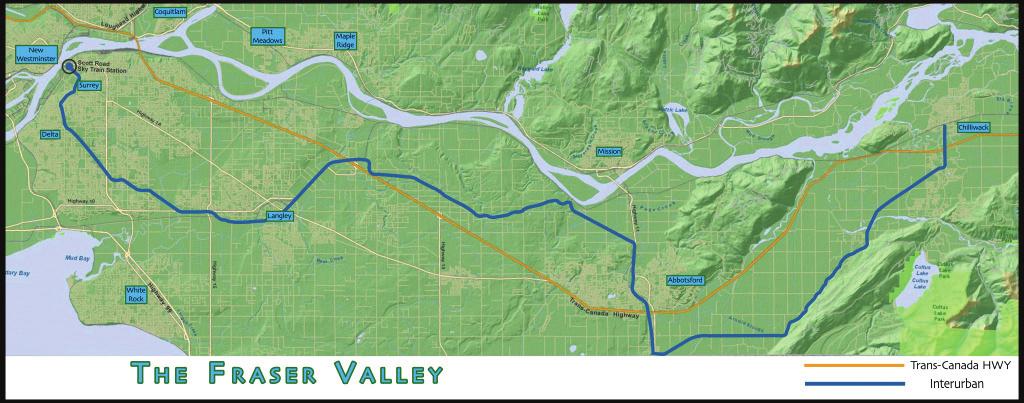
Service would see 16 FRA approved Stadler diesel light rail vehicles operating on 130 km of refurbished line connecting Chilliwack, Abbotsford, Langley, South Surrey, and North Delta, with downtown Vancouver.
A new combined road/rail bridge replacing the decaying Patullo Bridge and the downright decrepit Fraser River Rail Bridge, would ensure enhanced TramTrain service throughout the Fraser Valley.
Here is a plan that maybe would muster a YES vote at a referendum!
The Compass Card boondoggle is akin to the NDP’s bungled FastFerry program, but where is the mainstream media; where are the so called pundits tut-tutting this fiasco?
The Compass Card and fare gate program was orchestrated by the BC Liberals and Liberal government friendly media to cure the fictitious problem of ‘massive’ fare evasion.
Yes, there is fare evasion on TransLink, but from all accounts it fell within industry norms and transit authority treated fare evasion as a nuisance.
Former Premier Campbell’s best buddy and former Vancouver City manager, “Shreddin Ken” Dobell, was acting as a lobbyist for Cubitt Industries, makers of fare gates and fare cards, and what “Shreddin Ken” wanted, Gordon Campbell made sure “Shreddin Ken” got.
Thus the fare evasion myth was created with everyone bemoaningAi?? the nuisance, but the mainstream media continued their propaganda campaign so much that the public demanded fare gates and the Compass Card.
The insult to the taxpayer is now apparent, the Compass Card, unwanted by TransLink, is doomed to fail. For added insult, it now seems that the Compass Card, fare gate operation will cost about 50% more to operate than what was lost due to fare evasion.
BC Liberal economics at work!
A rare thank you to CKNW Radio for reporting on this boondoggle.
Former TransLink insider says Compass Card program destined to fail
As the operators of Metro Vancouverai??i??s transit services continue to defend the regionai??i??s troubled Compass card program, a former SkyTrain insider predicts it will failai??i?? if major improvements are not made.
ai???The main problem was the choke points of fare gates on the passenger flow.ai???
George Slade, who was an IT manager from 2008 to 2010, says Translink executives had good reason for being skeptical when they were told smart cards would be introduced.
ai???A zone fare system doesnai??i??t work with smart cards period. Itai??i??s assuming that everybody is going to behave perfectly. People do simply forget to tap off and then, they get charged for a full day.ai???
He says, when he reported five years ago London, Englandai??i??s now-cancelled similar system would fail, he was accused of not being a ai???team player,ai??i?? but since then two subsequent managers have complained Compass will never work.
ai???When the politicians basically dictate that something is going to happen, anything contrary to what the politicians say is considered not team play.ai???
CKNW has reached out for comment from TransLink officials, but they have declined.
2015 Metro Vancouver Transportation and Transit Plebiscite Voting Results
FOR IMMEDIATE RELEASE
July 2, 2015
VICTORIA ai??i?? The voting results for the 2015 Metro Vancouver Transportation and Transit Plebiscite were submitted today to the Speaker of the Legislative Assembly.
According to section 282(1) of the Election Act, the purpose of a plebiscite is to determine the opinion of voters on a matter of public concern. Of the 759,696 ballots considered, the majority of validly cast votes were opposed to the question on the ballot.
The plebiscite question was: Do you support a new 0.5% Metro Vancouver Congestion Improvement Tax, to be dedicated to the Mayorsai??i?? Council transportation and transit plan?
The final voting results are:
% of valid votes voting YesAi??Ai?? 38.32%
% of valid votes voting NoAi??Ai??Ai?? 61.68%
Municipality
Yes
votes
Yes
%
No
votes
No
%
Total
valid
votes
Bowen Island Municipality
Ai??847
61.92%
Ai??521
38.08%
Ai??1,368
City of Burnaby
Ai??24,355
35.06%
Ai??45,113
64.94%
Ai??69,468
City of Coquitlam
Ai??14,200
32.78%
Ai??29,120
67.22%
Ai??43,320
City of Langley
Ai??2,226
27.71%
Ai??5,807
72.29%
Ai??8,033
City of Maple Ridge
Ai??6,404
22.97%
Ai??21,470
77.03%
Ai??27,874
City of New Westminster
Ai??10,623
45.45%
Ai??12,748
54.55%
Ai??23,371
City of North Vancouver
7,931
44.92%
9,725
55.08%
17,656
City of Pitt Meadows
Ai??1,762
27.84%
Ai??4,568
72.16%
Ai??6,330
City of Port Coquitlam
Ai??6,346
32.15%
Ai??13,394
67.85%
Ai??19,740
City of Port Moody
Ai??4,852
42.61%
Ai??6,534
57.39%
Ai??11,386
City of Richmond
Ai??16,257
27.61%
Ai??42,615
72.39%
Ai??58,872
City of Surrey
Ai??42,519
34.46%
Ai??80,851
65.54%
Ai??123,370
City of Vancouver
Ai??103,431
49.19%
Ai??106,818
50.81%
Ai??210,249
City of White Rock
Ai??3,139
40.74%
Ai??4,566
59.26%
Ai??7,705
Corporation of Delta
Ai??11,589
32.16%
Ai??24,448
67.84%
Ai??36,037
District of North Vancouver
Ai??14,569
44.61%
Ai??18,093
55.39%
Ai??32,662
District of West Vancouver
Ai??6,876
44.11%
Ai??8,711
55.89%
Ai??15,587
Metro Vancouver Electoral Area ai???Aai???
Ai??1,586
58.57%
Ai??1,122
41.43%
Ai??2,708
Township of Langley
Ai??9,890
25.03%
Ai??29,619
74.97%
Ai??39,509
Tsawwassen First Nation
Ai??86
33.99%
Ai??167
66.01%
Ai??253
Village of Anmore
Ai??303
37.88%
Ai??497
62.13%
Ai??800
Village of Belcarra
Ai??158
52.15%
Ai??145
47.85%
Ai??303
Village of Lions Bay
Ai??202
34.71%
Ai??380
65.29%
Ai??582
Totals
Ai??290,151
38.32%
Ai??467,032
61.68%
Ai??757,183
Rejected ballots
Ai??2,513
Total ballots considered
Ai??759,696
Beginning March 16, 2015, Elections BC mailed a 2015 Metro Vancouver Transportation and Transit Plebiscite voting package to each registered voter in Metro Vancouver. As of the May 15, 2015 deadline to register to vote and ask for a voting package, there were 1,562,386 registered voters in Metro Vancouver. A total of 798,262 ballot packages were returned, representing 51.09% of the total registered voters. 38,393 ballot packages were not considered as they did not meet the requirements of the plebiscite Regulation.
Registered voters in Metro Vancouver midnight, Friday, May 15, 2015
1,562,386
Total number of ballot packages returned
798,262
Percentage of ballot packages returned
51.09%
Total number of ballot packages not considered
38,393
Total number of ballot packages considered (registered voters who voted)
759,869*
Percentage of registered voters who voted
48.64%
*759,869 ballot packages were considered. 173 ballot packages contained certification envelopes with either two or more ballots, or no ballot. In accordance with the Regulation, these envelopes were resealed and set aside.
The Report of the Chief Electoral Officer on the 2015 Metro Vancouver Transportation and Transit Plebiscite ai??i?? March 16-July 2, 2015 is expected to be published in September 2015 and will describe the activities Elections BC undertook to administer the plebiscite, voting results by municipality and a statement of Elections BCai??i??s expenses.
For more information, visit the Elections BC website at elections.bc.ca.
Not as well known on this side of the pond, but very well known in the U.K., publisher Ian AllenAi??OBE, FCIT has passed away at the age of 93.
Ian Allen Publishing is a prominent publisher of many transit and vehicle magazines and books, with a large range of monthly magazines pertaining to trains, trams, buses, and military vehicles.
Members of Rail for the Valley should take note that Ian Allen Ltd. and the Light Rail Transit Association are joint publishers of Tramways and Urban Transit, the foremost publication on the subject of transit.
I think $3 billion is a tad too expensive, but I am sure Mr. Haveacow will explain the reasons why.
I still maintain that we must plan and build LRT much cheaper than we are currently doing.
On another issue, the claim that: ” noise and vibrations ai??i?? both from the construction and trains themselves ai??i?? will disturb the seniors home and childcare centre”, is unfounded and some people seem to complain for the sake of complaining.
I think transit officials have better thing to do than to deal with trivial complaints, of the “trains will spoil the milk” variety.
City of Ottawa A design of Ottawa’s light rail transit (LRT) project.
The second stretch of Ottawaai??i??s light rail transit project is one step closer to becoming a reality for transit riders.
The cityai??i??s finance and economic development committee approved the $3-billion design on Tuesday. If council gives phase two the final approval, then city staff will get the go-ahead to invest a further $7 million in this next step.
The meeting lasted the length of an average workday. A whopping 25 people addressed the committee on light rail (LRT), with most being from the First Unitarian Congregation of Ottawa, who were concerned because the planned route will pass by their campus.
Mayor Jim Watson said the LRT will ultimately benefit those residents.
ai???I think the folks at Unitarian have a great opportunity to have one of the best stations within a walking distance for both the parishioners, as well as both the residents and visitors,ai??? he said.
The second phase of the LRT still needs confirmed funding from the provincial and federal governments before shovels can hit the ground in 2018 (after the projectai??i??s first phase is on track).
The plan is to have the LRTai??i??s 19 new stations and 30 kilometres of rail running by 2023.
And perhaps there will be an LRT phase three. Kanata South Coun. Allan Hubley tabled a motion asking city staff to look at extending the railway to Kanata ai???at the earliest opportunity.ai???









Recent Comments