Cutting edge to the cutter’s torch. (A repost from 2011)
What happens to old transportation technology?
It becomes less valuable than scrap!
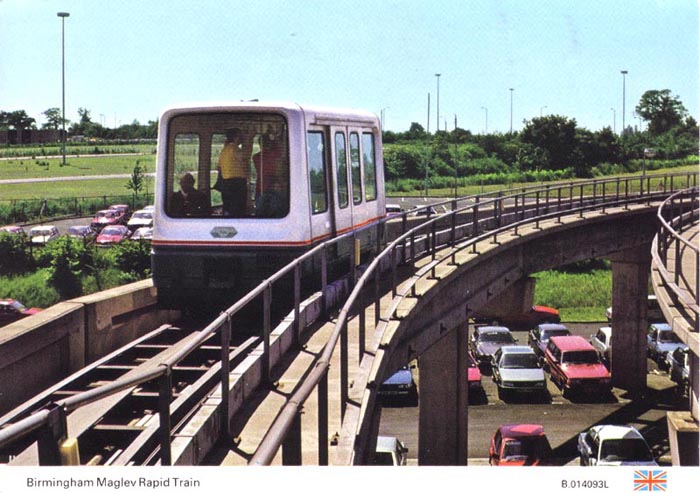
The Birmingham airport MAGLEV was cutting edge transportation technology in 1984 (two years before the SkyTrain Expo Line opened) but by 1995 was scrapped as obsolete.
This is reminiscent of another cutting edge transportation technology more than a century ago, the atmospheric railway. Touted in the 1840’s as a replacement for the new steam railway, a decade later it became but a bad memory for its promoters. The first practical use of the system was on the Dublin and Kingstown Railway’s Dalkey Atmospheric Railway between Kingstown (DA?n Laoghaire) and Dalkey,  Ireland. This 1.75-mile (2.82 km) line was built by Vignoles and surprisingly operated between 1844 and 1854, only slightly shorter than the eleven year run of the Birmingham Airport MAGLEV. The few other atmospheric railways built barely lasted a year in operation.
The lesson to be learned in this sad tale is that today’s ‘state of the art’ transit system is tomorrow’s obsolete transit system, something that TransLink hasn’t realized with the automatic proprietary SkyTrain light-metro system.
Birmingham Airport’s MAGLEV carriage resold for A?100

A magnetic carriage that transported people from Birmingham Airport to its railway station sold for just A?100 after a A?25,100 eBay bid was not paid.
The airport used a Magnetic Levitation (Maglev) line between 1984 and 1995 before replacing it with cable cars.
The Maglev carriage attracted 35 bids and was sold on the internet auction site eBay in November for A?25,100.
The bidder defaulted but Andy Jones from Warwickshire snapped it up and is moving it to his home near Kenilworth.
Mr Jones said: “The Magnetic Levitation Line came out of use back in 1995 and was put to one side by the Birmingham Airport people and at the back end of last year they decided to sell it on eBay.
Maglev memories
“The bidding went up to A?25,000 but whoever bought it the deal didn’t go through so it went back on eBay again at the start of this year for Help the Heroes and a hospice.
“So I thought I would get things going by putting in an opening bid of A?100 and nobody else bid for it.
“As a consequence I’ve got a five tonne train to get shifted into a field opposite my house and I’ve now got to find a suitable use for it.”
He said he used to be a frequent flyer from Birmingham Airport and remembered riding on the Maglev.
He said: “As a British invention of its day I thought it was absolutely tremendous. It was the forefront of its technology and a high speed Maglev has just been opened up in Shanghai which I think is a direct development of what took place in the old days.”
He plans to work with local companies to refurbish it and to install lighting and seating and said he wanted to hear from any groups who thought they could put it to good use.
Stop fighting Massey bridge, Delta mayor doesn’t get it
Some politicians ‘get it’ and many other don’t; the same goes with regional transportation planning.
Delta’s Mayor, Lois Jackson clearly doesn’t get it. The proposed Massey Tunnel replacement bridge will not solve congestion, only move it a few kilometres from Delta, across the river into Richmond.
Someone must explain to Mayor Jackson, that unless a new crossing into Vancouver is also built, a multi billion dollar eight or ten lane bridge, replacing the Massey tunnel will do little or nothing relieving congestion and may well exacerbate gridlock in Richmond.
The BC Liberal’s meddling in regional transit affairs is just leading us down the road to a massive financial and transportation disaster and the government’sAi?? hanger-on’s, in regional government are doing the taxpayer and the commuter a great disservice promoting the Liberal’s back of an envelope planning.

Stop fighting Massey bridge, Delta mayor urges Metro Vancouver
Delta Mayor Lois Jackson is calling a TransLink study “garbage” after it cast doubt on the merits of building a new bridge to replace the Massey Tunnel.
The report estimates peak travel times from South Surrey near the U.S. border to the Oak Street Bridge in Vancouver would be 31 minutes in 2045 with a new eight-lane toll bridge ai??i?? compared to 35 minutes now ai??i??Ai??or 38 minutes if the new bridge is not tolled.
It also forecast a travel time of 32 minutes if the existing four-lane tunnel is tolled and no new bridge is built at all.
“It’s absolutely ridiculous,” Jackson said. “Anybody that travels that road, anybody that lives there and understands our communities south of the river would know that’s bumph.”
She urged Metro Vancouver directors at a March 12 transportation committee meeting to accept that the province is going to build the new bridge to replace the congested tunnel and not to “waste our time” trying to defeat the project.
“It’s so frustrating for me, I just vibrate,” Jackson said after the meeting, adding TransLink refused to study Highway 99 congestion for years until she gave up and lobbied the province directly for a new bridge.
Premier Christy Clark announced the new bridge last fall but has not yet indicated how large it will be or if it will be tolled. Preliminary studies are underway and a project definition report from the province is expected this spring.
Jackson said there’s no question in her mind the new bridge will be tolled, the only issue is how much the toll will be and whether other currently free bridges will also be tolled at the same rate.
She agreed tolling has a major effect on traffic flows and said a good regional analysis is needed on the potential effect of tolling all crossings, not just a study that looks only at one corridor.
“Some day the Second Narrows is going to have to be replaced and the Arthur Laing and all the others,” Jackson said.
“If all those lanes were tolled at a very low rate ai??i??Ai??say 50 cents or a dollar ai??i??Ai??people could understand that and accept that and they would take the bridges and they would go the shortest distance between their two points.”
If only some bridges are tolled, she said, people will go out of their way to save money.
If the Massey crossing and the Pattullo Bridge replacement are tolled, leaving only the Alex Fraser free, she added, it will be unusably jammed, while “you can play a golf game” on the Golden Ears.
Surrey Mayor Dianne Watts also called the study flawed, saying it fails to look at the regional effects on other crossings of adding a new bridge.
Richmond Mayor Malcolm Brodie said any future study needs to look further north to determine if traffic will just pile up at the Oak Street Bridge because of the bottleneck at the entrance to Vancouver.
Jackson said that concern is overstated, adding large numbers of vehicles stop in Richmond ai??i??Ai??for jobs, shopping, access to the airport and to board the Canada Line ai??i??Ai??rather than driving into Vancouver.
Burnaby Mayor Derek Corrigan said adding more lanes of traffic will intensify pressure to develop farmland in Surrey and Delta.
“We have to look at the big picture,” said North Vancouver City Mayor Darrell Mussatto. “Otherwise we are going to have a region dominated by the automobile forever.”
Oops, Evergreen Line Guideway Shifts
When you do expensive jobs on the cheap, s**t happens.
Looks like the guideway fell off its bearings, I wonder why?

Coquitlam road closed by incident involving 300-tonne guideway at Evergreen Line construction site
Ai??By TIFFANY CRAWFORD, VANCOUVER SUN
METRO VANCOUVER – A 300-tonne beam dislodged early Friday on the new Evergreen SkyTrain Line in Coquitlam, forcing authorities to close a major commuter road.
Como Lake Avenue, which runs under the SkyTrain line in Coquitlam, is closed in both directions as engineers work on the section of the guideway, according to the Ministry of Transportation.
Amanda Farrell, project director for the Evergreen Line, said at around 1 a.m., a temporary concrete spacer that sits between the column and the guideway beam at Como Lake and Clarke Road failed, causing the beam to shift about six inches.
ai???This particular beam is slightly different and slightly more curved than the normal beams because itai??i??s going to come up and swoop over the intersection and down toward Coquitlam and itai??i??s going to be connected to other beams,ai??? she said.
She said engineers put in temporary metal spacers and then later will replace it with a permanent concrete spacer. She could not say why the spacer failed.
ai???Thatai??i??s what the engineers are out there doing now. They are looking at why it failed, how they are going to fix it and whether the road can reopen,ai??? she said.
When asked whether that 300-tonne beam could have fallen on the road, potentially crushing a vehicle, Farrell said there were no public safety concerns.
ai???Iai??i??ve been talking to the engineers here. The beam is on four points of contact and what they are telling me is that it is very stable where it is now and thatai??i??s not a concern,ai??? she said. ai???I donai??i??t want to speculate while they are out there investigating until I have all the facts.ai???
She said engineers have been following the standard methodology for building the SkyTrain and to her knowledge she had never heard of anything like this happening before during construction of a SkyTrain line.
ai???We will have to look at what has happened here and why that temporary spacer failed.ai???
The Coquitlam RCMP received several calls after the incident happened, with people saying they had heard a loud bang. Como Lake is expected to remain closed until around noon. The ministry says flagger personnel are at the location, helping motorists with detours. TransLink says due to the problem with Evergreen bus number 143 is detouring.
The $1.4-billion rapid transit line is slated to open in 2016 and connect Burnaby and Coquitlam. Tunnelling is expected to begin within days.
Once complete, the Evergreen Line will connect the Tri-Cities to the rest of the SkyTrain system, creating the longest rapid transit network in Canada, at 79 kilometres
http://www.vancouversun.com/news/metro/Coquitlam+road+closed+incident+Evergreen+Line+construction/9617740/story.html
With a file from Kelly Sinoski
U.S. (And Canada) Taxpayers Are Gouged on Mass Transit Costs (a repost from 2012)
With BC Transit quoting silly prices for LRT in Victoria and TransLink doing the same in Vancouver and Surrey, the following article from Bloomberg should be essential reading. As the previous post has shown, modern LRT/streetcar can be built cheaply, if there is the political and bureaucratic will to do so.
With thank to Justin Bernard.

U.S. Taxpayers Are Gouged on Mass Transit Costs
ByAi??Ai??Ai??Ai??Ai??Ai??Ai?? Stephen SmithAi??Ai??Ai??Ai??Ai?? Aug 26, 2012
Bloomberg
If the first segment of Manhattanai??i??s Second Avenue subway opens on schedule in 2016, New Yorkers will be reminded that it was once ai???the line that time forgotai??? — a project more than 75 years in the making, with no end in sight. It should be remembered for another failing as well: It will be one of the most expensive subways in the world.
Tunneling in any dense urban environment is an expensive proposition, but the $5 billion price tag for just the first two miles of the Second Avenue subway cannot be explained by engineering difficulties. The segment runs mainly beneath a single broad avenue, unimpeded by rivers, super-tall skyscraper foundations or other subway lines.
American taxpayers will shell out many times what their counterparts in developed cities in Europe and Asia would pay. In the case of the Second Avenue line and other new rail infrastructure in New York City, they may have to pay five times as much.
Amtrak is just as bad. Its $151 billion master plan for basic high-speed rail service in the Northeast corridor is more expensive than Japanai??i??s planned magnetic levitating train line between Tokyo and Osaka, most of which is to be buried deep underground, with tunnels through the Japan Alps and beneath its densest cities.
The numbers for Californiaai??i??s proposed high-speed rail system are similarly shocking.
California Bloat
The French rail operator SNCFAi??told the California High-Speed Rail Authority that it could cut $30 billion off the projectai??i??s $68 billion estimated price tag. San Francisco can barely build underground light rail for the price that Tokyo pays for high-capacity subways. Los Angelesai??i??s planned subway to the sea will be a bit cheaper, but is still very expensive considering the areaai??i??s lack of density.
The budgets for other types of urban public-works projects can be just as shocking. Who can forget Bostonai??i??s Big Dig, the$24 billionAi??highway boondoggle? But mass-transit networks stand to lose most from out-of-control infrastructure costs.
A huge part of the problem is that agencies canai??i??t keep their private contractors in check. Starved of funds and expertise for in-house planning, officials contract out the project management and early design concepts to private companies that have little incentive to keep costs down and quality up. And even when they know better, agencies are often forced by legislation, courts and politicians to make decisions that they know arenai??i??t in the public interest.
Comparing American transit-construction practices with those abroad yields a number of lessons. Spain has the most dynamic tunneling industry in the world and the lowest costs. In 2003, Metro de Madrid Chief Executive Officer Manuel Melis Maynar wrote a list describing the practices he used to design the systemai??i??s latest expansion. The donai??i??t-do list, unfortunately, reads like a winning U.S. transit-construction bingo card.
Perhaps the most ostentatious violation of Melisai??i??s manual of best practices is expensive architecture in stations. ai???Design should be focused on the needs of the users,ai??? he wrote, ai???rather than on architectural beauty or exotic materials, and never on the name of the architect.ai???
American politicians have different priorities. The Port Authority of New York and New Jersey is spending $3.8 billion on a single subway station at the World Trade Center designed by Santiago Calatrava, a Spanish architect known for his costly projects. If New York could build subways at the prices that Paris and Tokyo pay, $3.8 billion would be enough to build the entire Second Avenue subway, from Harlem to the Financial District.
Spainai??i??s Model
Melis also warned against ai???consultants who consultant with consultants and advisers who advise advisers,ai??? something American planners would do well to learn. He said he didnai??i??t hire any ai???large firm of consulting engineersai??? as general project managers for his Metro de Madrid expansions, and that designers werenai??i??t allowed to interfere with, or bid for, their own construction contracts.
Not so in the U.S. Parsons Brinckerhoff, perhaps the biggest name in the nationai??i??s transit construction industry, is both the lead-design contractor and project manager for Californiaai??i??s planned high-speed rail line, and the company stands a good chance of winning construction contracts for its own designs.
As if that conflict of interest wasnai??i??t bad enough, the California High-Speed Rail Authorityai??i??s new CEO, Jeff Morales, arrived at the agency after a stint as senior vice present at Parsons Brinckerhoff, where he worked on the authorityai??i??s business plan.
Parsons Brinckerhoff, like all the other multinational contractors and construction companies that win bloated contracts in the U.S., can do good work. Its rail projects for Hong Kongai??i??s Mass Transit Railway were built at a reasonable cost, and its participation in Turkeyai??i??s Marmaray rail tunnel across the Bosporus in Istanbul shows that it can deliver affordable results in forbidding terrain. But absent the right incentives and oversight, even the best private companies will resort to rent seeking.
Larry Littlefield, who has worked in logistics and as a budget analyst at New York City Transit, also suggests the U.S. legal system is an obstacle to designing and building affordable infrastructure. (The U.K. and India share a common-law legal heritage with the U.S. that is heavy on judicial review, and they also have trouble controlling costs.)
New York government agencies are saddled by procurement rules dating back generations, Littlefield says, when corruption in infrastructure projects was endemic. Reformers demanded objective and easily policeable standards, which often meant lowest-price bidding rules. Bidders compete mostly on price, not quality.
Speed Matters
In Madrid, on the other hand, cost was given only a 30 percent weight when picking designers and builders, according to Melis. Speed was weighted at 20 percent. Melis praised quick execution as necessary for an efficient, affordable project. (Compare this with multigenerational projects, such as Californiaai??i??s high-speed rail and New Yorkai??i??s Second Avenue subway.) The remaining 50 percent was determined by the technical merits of proposals and the staffai??i??s subjective considerations.
Littlefield also argues that judges in New York routinely side with contractors in disputes with the Metropolitan Transportation Authority. ai???In the private sector, if you rob your customer, you will suffer a hit to your reputation and possible losses in the courts,ai??? he said in an interview. ai???Not so if you rob an agency like the MTA. Then itai??i??s all rights and no responsibilities.ai???
The MTA must continue to award contracts to the lowest-price bidder, and without the ability to hold bad contractors accountable, Littlefield said, the agency turns to ai???writing longer and longer and longer contracts, expressly prohibiting every way it has been ripped off in the past.ai??? The byzantine contracts that come out of this process drive entrants away, limiting competition and pushing up costs.
Littlefield holds out hope, however, that transit agencies are capable of building with reasonable costs and timelines –at least when they have to. ai???Remember how fast and how cheap they rebuilt the 1 train after 9/11? Thatai??i??s what theyai??i??re capable of. But it just doesnai??i??t happen otherwise.ai???
(Stephen Smith is a writer based in Brooklyn, New York, who covers land use and transportation. The opinions expressed are his own.)
To contact the writer of this article: Stephen Smith at smithsj@gmail.com.http://www.bloomberg.com/news/2012-08-26/u-s-taxpayers-are-gouged-on-mass-transit-costs.html
New Tram-Train service in France
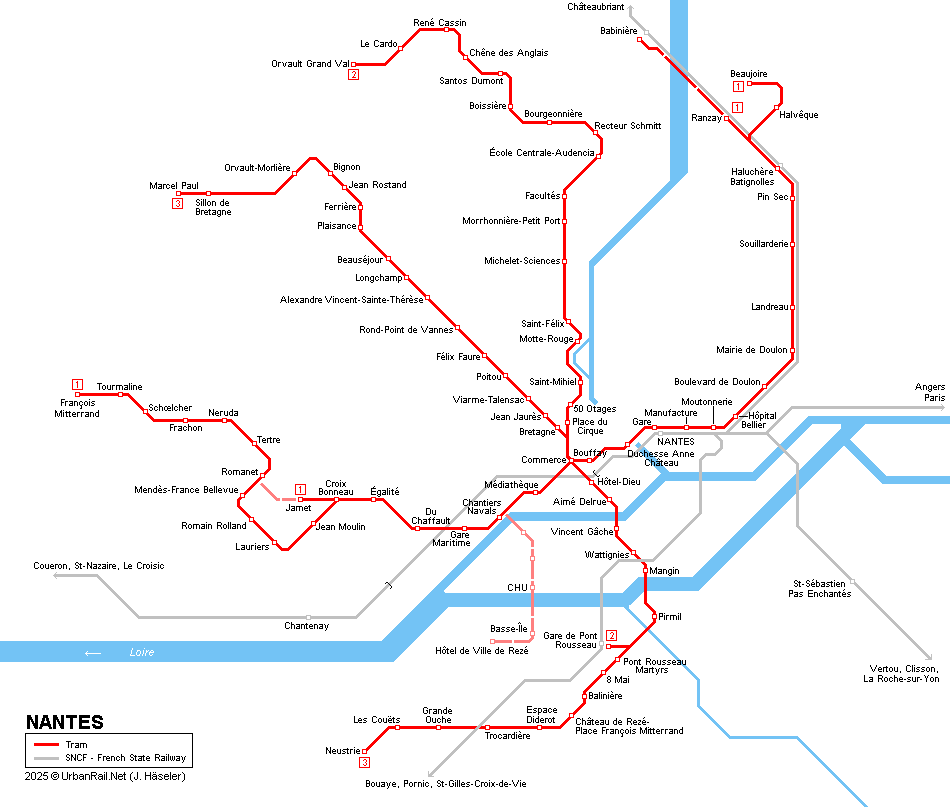
FRANCE: Tram-train services on a 64 km route linking Nantes and ChA?teaubriant are launched by SNCF on February 28.

Opening on 28 February a new tram-train service is now operational on the reopened regional railway between Nantes and ChA?teaubriant. The railway has been renovated totally after the closure for passenger service at 31 May 1980. Rolling stock is the Citadis Dualis, already operational at the mainline railway between Nantes and Clisson and at two regional railways in the south of France operating from Lyon St Paul station to Brignais and to San Bel. Renovation costs have been 210 million euro excluding 60 million euro for 12 tram-train vehicles. Operation costs will be 5,2 million euro annually excluding the maintenance costs of the rail infrastructure. An interesting feature is the level crossing between tram-trains of SNCF and local trams of Nantes tramway operating company TAN. This crossing is claimed to be unique in France. Daily 48 tram-trains and 220 trams will pass this crossing in both directions. Track layout, overhead configuration and signalisation have been designed and built specifically to this location. First photo displays a coupled tram-train unit ready for departure in the new built HaluchA?re-Batignolles stop
http://www.railwaygazette.com/news/passenger/single-view/view/nantes-chateaubriant-tram-train-services-launches-this-month.html
The tram-train service will use part of a former Nantes – Rennes railway route which originally opened in 1877. The Nantes – ChA?teaubriant section closed to passenger traffic in 1980 and to freight in 2008. This section has now been completely modernised in preparation for the tram-train services, with the track replaced and the 11 stations gaining new platforms, shelters, ticket machines and car parking.
Tramway signalling has been fitted, except at Nantes station, and automatic half-barriers have been installed at 30 level crossings, with 11 crossings closed.
The modernised line is designed to be suitable for use by conventional SNCF trains, including works trains, but no freight operations are planned. In contrast to the shared running on the Mulhouse tram-train service, the Nantes tram-trains will not use the city’s urban tram network, which is operated independently by Semitan.
Two dedicated platforms electrified at 25 kV AC have been built at Nantes station. After leaving the station, tram-trains will run through the suburbs on a 15 km double-track alignment with 750 V DC tramway electrification. This parallels a Semitan tram line, and shares five level crossings which follow tramway practice in having warning lights but no barriers. Near HaluchA?re-Batignolles station the Semitan line crosses the tram-train route on a flat crossing.
From BabiniA?re the line will operate as a railway, with 25 kV 50 Hz electrification and a maximum speed of 100 km/h. At the terminus a buffer stop separates tram-trains from the 62 km ChA?teaubriant – Rennes section of the former through route. This lies within Bretagne and has been unaffected by the project, with SNCF X2100 diesel multiple-units operating seven return trips a day.
Alstom has supplied 24 Citadis Dualis vehicles for the tram-train route, equipped with a toilet and more comfortable seats than conventional trams as the end-to-end journey takes 1 h 07 min. There will be seven return trips a day over the full length of the route, with higher frequencies between SucAi??-sur-Erdre and Nantes where there will be services every half hour in the peaks and hourly at other times. HaluchA?re-Batignolles will be served by 46 tram-trains a day. Ridership is predicted at 11 200 passengers/day
Project funding, ai??i??m |
||
|---|---|---|
Pays de Loire region |
62Ai??5 |
31Ai??5% |
Loire Atlantique department |
54Ai??0 |
27Ai??3% |
National government |
35Ai??3 |
17Ai??8% |
EU sources |
21Ai??0 |
10Ai??6% |
Nantes |
20Ai??3 |
10Ai??3% |
SNCF |
5Ai??2 |
2Ai??53% |
Total cost |
198Ai??3 |
|
http://www.alstom.com/transport/products-and-services/trains/tram-trains-citadis-dualis-and-regio-citadis/
Combining the best of trains and tramways
The challenge
The urban fabric now extends well beyond the city centre, with regional and urban networks tending to merge. Users’ needs are changing. They want to be able to move with ease from the city centre to neighbouring towns without having to change their transportation mode.
The Alstom solution
Introduced in Germany with the Regio Citadis, the concept of the tram-train has since been enriched by the Citadis Dualis model. This mode of transportation permits seamless daily journeys between city-centres and suburban centres.
Tram-trains benefit from the latest Alstom innovations
…to ensure seamless travel without load changes between city centres and suburbs
- Tram-trains run equally well on tramway networks and on regional rail networks (compatible power tension on wires, signalling and wheels),
- Alstom tram-trains have a reinforced structure in the event of a crash that conforms to the latest safety standards,
- Its collapsible coupling enables better shock absorption in stations.

BRT to LRT in Ottawa
Until now, Ottawa invested in BRT to move transit customers into the city. This of course to an operationally expensive transit system as employee costs can be as much a 80% of a transit system’s budget.
(Ottawa’s bus photo’s courtesy of Mr. Haveacow)

With BRT, buses jams were frequent and city streets became congested with buses.
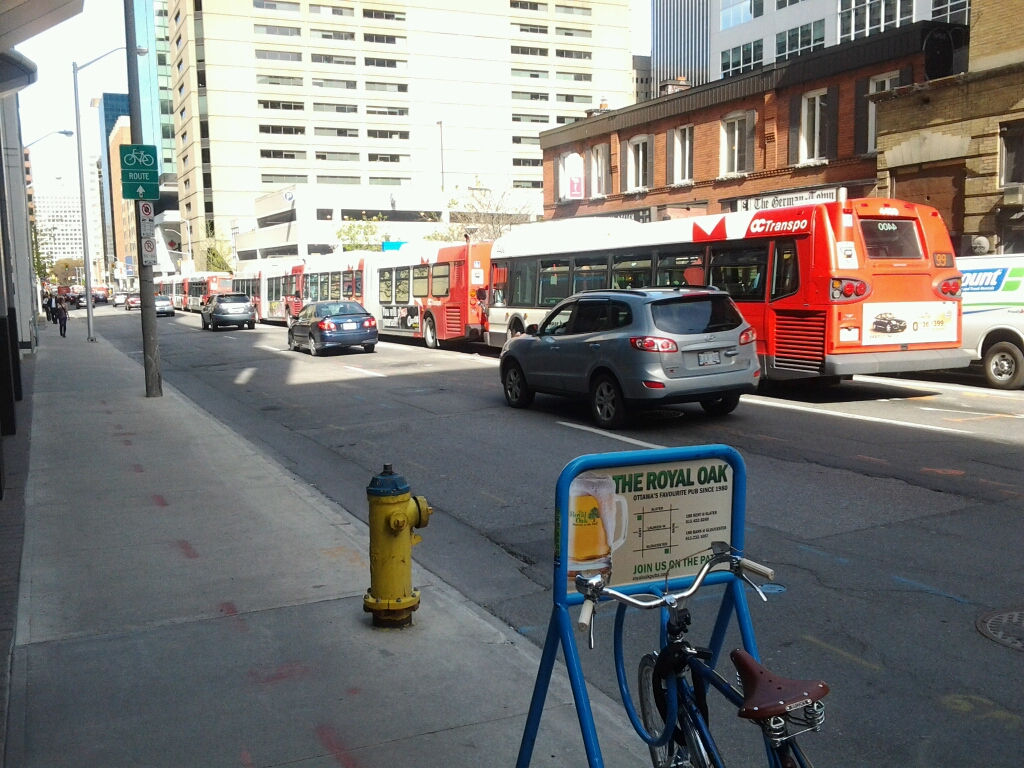
Congested busways tend not to be very efficient in moving people.

Congestion extended to the busways and the transit system began to buckle under the sheer weight of buses used.
 To alleviate bus congestion and associated diesel pollution, as well as reducing operating costs, Ottawa is now building with modern LRT, using European style modular cars, built by Alstom of France.
Whilst the cost of building with LRT is much higher than building busways, especially ifAi?? subways are built, the operating costs are much lower (not so much lower when including subways) as one modern tram and one driver, is as efficient as six buses and six bus drivers. Even someone doing calculations on the back of an envelope can understand the economy of operating modern light rail.
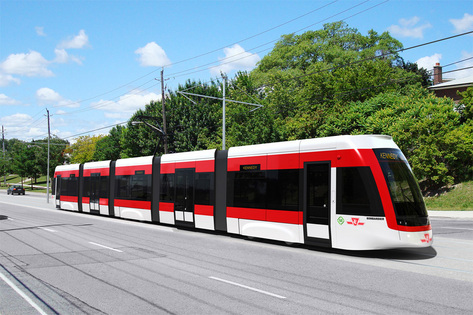
Now a memo for those who want a Broadway subway. The preceding pictures show the level of bus congestion needed before transit authorities begin to plan for light rail. On Broadway with a B-line bus every 3 minutes or so does not indicate a need for a subway, rather it indicates a need for better management. Current bus flows along Broadway warrant an economy LRT line and nothing more and of course when ridership demands more service, modern LRT can meet the challenge affordably.
The Moonbeam Line
The Moonbeam Line is an apt name for the for Vancouver Mayor, Gregor Robinson’s pet Broadway subway project, as the subway planning has a foundation of stuff and nonsense.
This hokumAi?? that a subway would be of “national significance”, is pure hoopla, from a mayor eager to spend vast sums of other people’s money for his city to satisfy his land developer friends needs for profits; especially if those profits need to be subsidized by the regional taxpayer.
As always, transit planning in the metro Vancouver region is all about politics and rewarding political friends and the transit customer and the taxpayer be damned.
This also begs the question; “Do we really want regional mayors running the transit system?”

Alison Bailey February 28, 2014 News Radio 1130
Robertsonai??i??s subway pitch is about prestige: LRT advocate Mayor of Vancouver says Broadway corridor subway would have national impact
LOWER MAINLAND (NEWS1130) ai??i?? Itai??i??s all about political prestige; thatai??i??s what people pushing for a rail connection between Vancouver and Chilliwack say about claims from the mayor of Vancouver that a subway line along the Broadway corridor would have a ai???nationalai??? impact.
ai???The ridership on Broadway just does not need a subway,ai??? says Malcolm Johnston with Rail for the Valley. ai???Subways need large passenger flows to justify the construction costs.ai???
The group would rather see bus service improved.
Johnston says while the B-Line service along Broadway is full, the trolley bus service is not. He argues excess capacity isnai??i??t being utilized.
ai???We could modernize our trolley bus fleet, bring it up to a modern standard and have stops maybe every 400 metres apart instead of every 200 metres apart; that speeds up the service.ai???
Johnston adds light rail should go in for higher capacity.
Mayor Gregor Robertson says a subway would help make Vancouver a global research hub, linking UBC to health science facilities. Heai??i??s hoping to get $4 billion thatai??i??s earmarked for projects of ai???national significance.ai???
http://www.news1130.com/2014/02/28/robertsons-subway-pitch-is-about-prestige-lrt-advocate/
Ottawa’s Transit system project

ai???The Transitwayai??i??, in Ottawa, is one of the most successful Bus Rapid Transit Systems in North America. However with the increase of traffic and demand the Council has decided to develop the Bus Rapid Transit System into to a Light Rail Transit one. This 20 year plus expansion will start its first phase with the Confederation Line. A $2.1 billion investment which will have a 13 station LRT running over 12.5 km. By making it a P3 project it has reduced the tax payers cost benefits. This project should help the local economy, community and create thousands of new jobs.
This $2.1 billion transportation project, supported by the federal, provincial and municipal governments, is the largest single project ever undertaken by the City of Ottawa in regards to scope, size and complexity. The project, which is the first stage in Ottawaai??i??s planned 40 km light rail network, will see the construction of a 12.5 km LRT system including 3 km of tunnel under the downtown, and 13 stations, three of which will be in the tunnel portion.Ai?? Implementation of the new system will include converting portions of the existing Bus Rapid Transit to light rail (one of the first such undertakings in North America). It is being carried out under a Design-Build-Finance-Maintain delivery model.
Project Cost:Ai??Ai??$2.1 billionAi?? Project Size:Ai??Ai??13.5 kmAi??Ai?? Project Duration:Ai??Ai?? 7 years
Project Challenge: One of the biggest challenges of this project is to convert an existing Bus Rapid Transit route and tunneling through the downtown core of Ottawa to a new light rail system. There are many private properties, environmental, heritage and utility coordination issues.
Ottawaai??i??s Light Rail Transit (OLRT) project, will enhance that cityai??i??s connectivity and create a greener downtown with a vastly improved streetscape.Ai?? This $2.1 billion transportation project, supported by the federal, provincial and municipal governments, is the largest single project ever undertaken by the City of Ottawa in regards to scope, size and complexity.Ai?? The OLRT system will take portions of the Bus Rapid Transit and convert them to Light Rail Transport (one of the first such undertakings in North America). ai??i??
This project is the first stage in Ottawaai??i??s planned 40 km light rail network.Ai?? In 2011, Morrison Hershfield together with three (3) other firms making up Capital Transit Partners (CTP), a joint venture, was awarded the Preliminary Design and Project Management mandate by the City of Ottawa in support of the development of a 12.5 km (7.8 mile) Light Rail Transit (LRT) system to the city. It includes a 3.2 km (1.9 mile) tunnel under the downtown and conversion of the existing exclusive Bus Transitway from Blair Road in the East toTunneyai??i??s Pasture in the West, to LRT.Ai??The OLRTAi??projectAi??includes 13 stations, withAi??three in the mined tunnel portion, one in cut and cover and the remaining at grade within the existing transit corridor. The project also includes a maintenance and storage facility to accommodate the new fleet of LRT vehicles.
The Plan:
The Confederation Line will be a significant part of OC Transpoai??i??s integrated transit network. It will connect to the existing Bus Rapid Transitway at Tunneyai??i??s Pasture Station in the west and Blair Road in the east, and to the O-Train at Bayview Station. Together with a 2.5km downtown tunnel, this light rail system will move Ottawa faster and in more comfort than ever before.
http://www.confederationline.ca/en/the-plan/what/
Why light rail transit?
http://www.confederationline.ca/en/the-plan/why/


Hutzpa!
What hutzpa!
The Broadway subway a transit project of national significance, really? I think Mayor Robinson thinks that the taxpayer are rubes.
According to our friend, Mr. Haveacow,Ai?? Broadway’s peak demand numbers on average of 2000-3700 passenger trips per hour per direction, which is barely enough to support light rail, let alone a subway.
What about SkyTrain’s lack of capacity and a $2 billion investment needed to increaseAi?? capacity on the SkyTrain ALRT/ART network? Are the SkyTrain and subway lobby’s waiting to drop that little bombshell later.
Sorry Mayor Robinson, one tires of Vancouver’s demands for billions of our tax dollars to build your fantasy subway, to keep up the image that Vancouver is a “world class city”. Your hutzpa is getting very stale.
 Modern LRT could provide ample capacity for Broadway, if only TransLink and the city of Vancouver were honest with their transit planning. Sadly, the SkyTrain centric planning at TransLink and City Hall as precluded any viable LRT plan for Broadway and with Vancouver’s rejection of an elevated line along Broadway (SkyTrain was first devised to be elevated to mitigate the high cost of subway planning), leaves the subway option, the only option.
Vancouver mayor wants UBC subway line considered of ai???national significanceai??i??
Getting federal money for the $3-billion line unlikely without such a designation, Robertson says
OTTAWA ai??i?? The Harper government needs to be convinced that the proposed $3-billion Broadway subway line to the University of B.C. is a project of ai???national significance,ai??? Mayor Gregor Robertson said Wednesday.Robertson, who was chairing a meeting of big-city mayors here, said a $14-billion, 10-year fund being promoted by the Conservative government is ai???woefully inadequateai??? to meet Canadaai??i??s infrastructure needs.
That program has only set aside $9 billion specifically for big cities, with $1 billion earmarked for smaller and typically more Tory-friendly municipalities.
Another $4 billion is targeted for projects of national strategic significance.
Asked if there is enough federal money on the table to get the Broadway project off the ground, Robertson replied: ai???That depends on whether the additional $4 billion of national infrastructure money is on the table.ai???
Cities, provincial governments and Ottawa typically cost-share major infrastructure projects.
Robertson said Vancouver will make the case to Ottawa that all Canadians would benefit from the subway.
Linking UBC to major health sciences institutions along the corridor, including the Vancouver General Hospital and the BC Centre for Disease Control, would advance Vancouverai??i??s ability to become a global research hub.
ai???We will see companies from all over the world coming to Vancouver if thereai??i??s good connectivity,ai??? he said in an interview. ai???The cities we compete with globally in technology are well-connected and are invested in rapid transit, and we need to keep pace. So it will have a nationally significant economic impact.ai???
A 2013 KPMG report commissioned by UBC and the city said the current bus system along the route is operating over capacity.
It also said there is little chance given constrains on the road to expand bus service to deal with an anticipated doubling of the population along the corridor over the next 30 years.
Cities like Toronto and New York have a ai???clear competitive advantage over Vancouver: they have a public transportation network that provides rail rapid transit between their major employment centres and their academic research facilities,ai??? the report noted.
Robertsonai??i??s comments came after one of the more controversial gatherings of big-city mayors because it included, for the first time, Toronto Mayor Rob Ford.
Ford, who has in the past dismissed the Federation of Canadian Municipalities as an organization of left-leaning politicians who waste tax dollars, arrived in Ottawa to push for Torontoai??i??s ai???fair shareai??? of transit funding.
Montreal Mayor Denis Coderre sneered at Fordai??i??s decision to attend, saying it would create a ai???circusai??? atmosphere. But Robertson said Ford, who spoke publicly to reporters Wednesday about his boozing and crack-smoking past, was a welcome addition to the lobby group.
ai???Itai??i??s important to have Toronto at the table,ai??? he said. ai???Itai??i??s been a distraction for some outside the room, but between mayors weai??i??re very focused on our priorities on housing and transit.ai???
Light Rail & Tram ridership

Have received the following statistics from an Aussie mate, who is resident in Europe.
| 1 | St Petersburg: tram 476 mill pax p.a., 205 route km. | Ai??2 | Budapest: tram 393 mill pax p.a., 156 route km. |
| 3 | Prague: tram 324 mill pax p.a., 141 route km. | Ai??4 | Warsaw: tram 270 mill pax p.a., 120 route km. |
| 5 | Moscow: tram 251 mill pax p.a., 163 route km. | Ai??6 | Hong Kong: tram and light rail 245 mill pax p.a. |
| 7 | Vienna: tram and light rail 240 mill pax p.a., 240 route km. | Ai??8 | Zagreb: tram 214 mill pax p.a., 148 route km. |
| 9 | Zurich: tram 202 mill pax p.a., 126 route km.Ai?? | 10 | Melbourne: tram 191 mill pax p.a., 250 route km. |
| 11 | Brno: tram 188 mill pax p.a., 139 route km. | Ai??12 | Yekaterinburg: tram 180 mill pax p.a., 180 route km. |
| 13 | Berlin: tram 173 mill pax p.a., 192 route km. | Ai??14 | Stuttgart: tram/light rail 170 mill pax p.a., 192 route km. |
| 15 | Dresden: tram 145 mill pax p.a., 134 route km. | Ai??16 | Istanbul: tram 140 mill pax p.a. 22 route km |
| 17 | Gothenburg: tram 140 mill pax p.a., 144 route km. | Ai??18 | Leipzig: tram 134 mill pax p.a., 148 route km. |
| 19 | Amsterdam: tram 130 mill pax p.a., 138 route km. | 20 | Bordeaux: 127 mill pax p.a.; 44 route km |
| 21 | Brussels: tram 124 mill pax p.a.; 139 route km | 22 | Paris: tram 114 mill pax p.a., 75 route km. |
| 23 | Strasbourg: 110 mill pax p.a.; 55 route km | 24 | Toronto: tram 105 mill pax p.a., 150 route km. |
| 25 | Munich: tram 104 mill pax p.a., 79 route km. | 26 | London: Docklands Light Railway 100 mill pax p.a. 400 route km |
| 27 | Montpellier: 100 mill pax p.a.; 63 route km | 28 | Nantes: 97 mill pax p.a.; 42 route km |
| 29 | Lyons: 91 mill pax p.a.; 78 route km | 30 | Marseilles: 33 mill pax p.a.; 12 route km |
| 31 | London:Ai?? [Croydon] Tramlink tram 34 mill pax p.a.; 28 route km; | 32 | Manchester: tram 32 mill pax p.a. 77 route km |



Recent Comments